本文へスキップ

Chart Graphics

Create clear chart graphics for reports, presentations, and social posts by turning metrics into readable visual comparisons.

2026.07.17

「Chart Graphics」を思いどおりに作りましょう自分だけの「Chart Graphics」を作る

ふだんの言葉で伝えるだけで、Caratが最適な画像や動画を生成します。

毎日100クレジット無料で今すぐ始められます
·
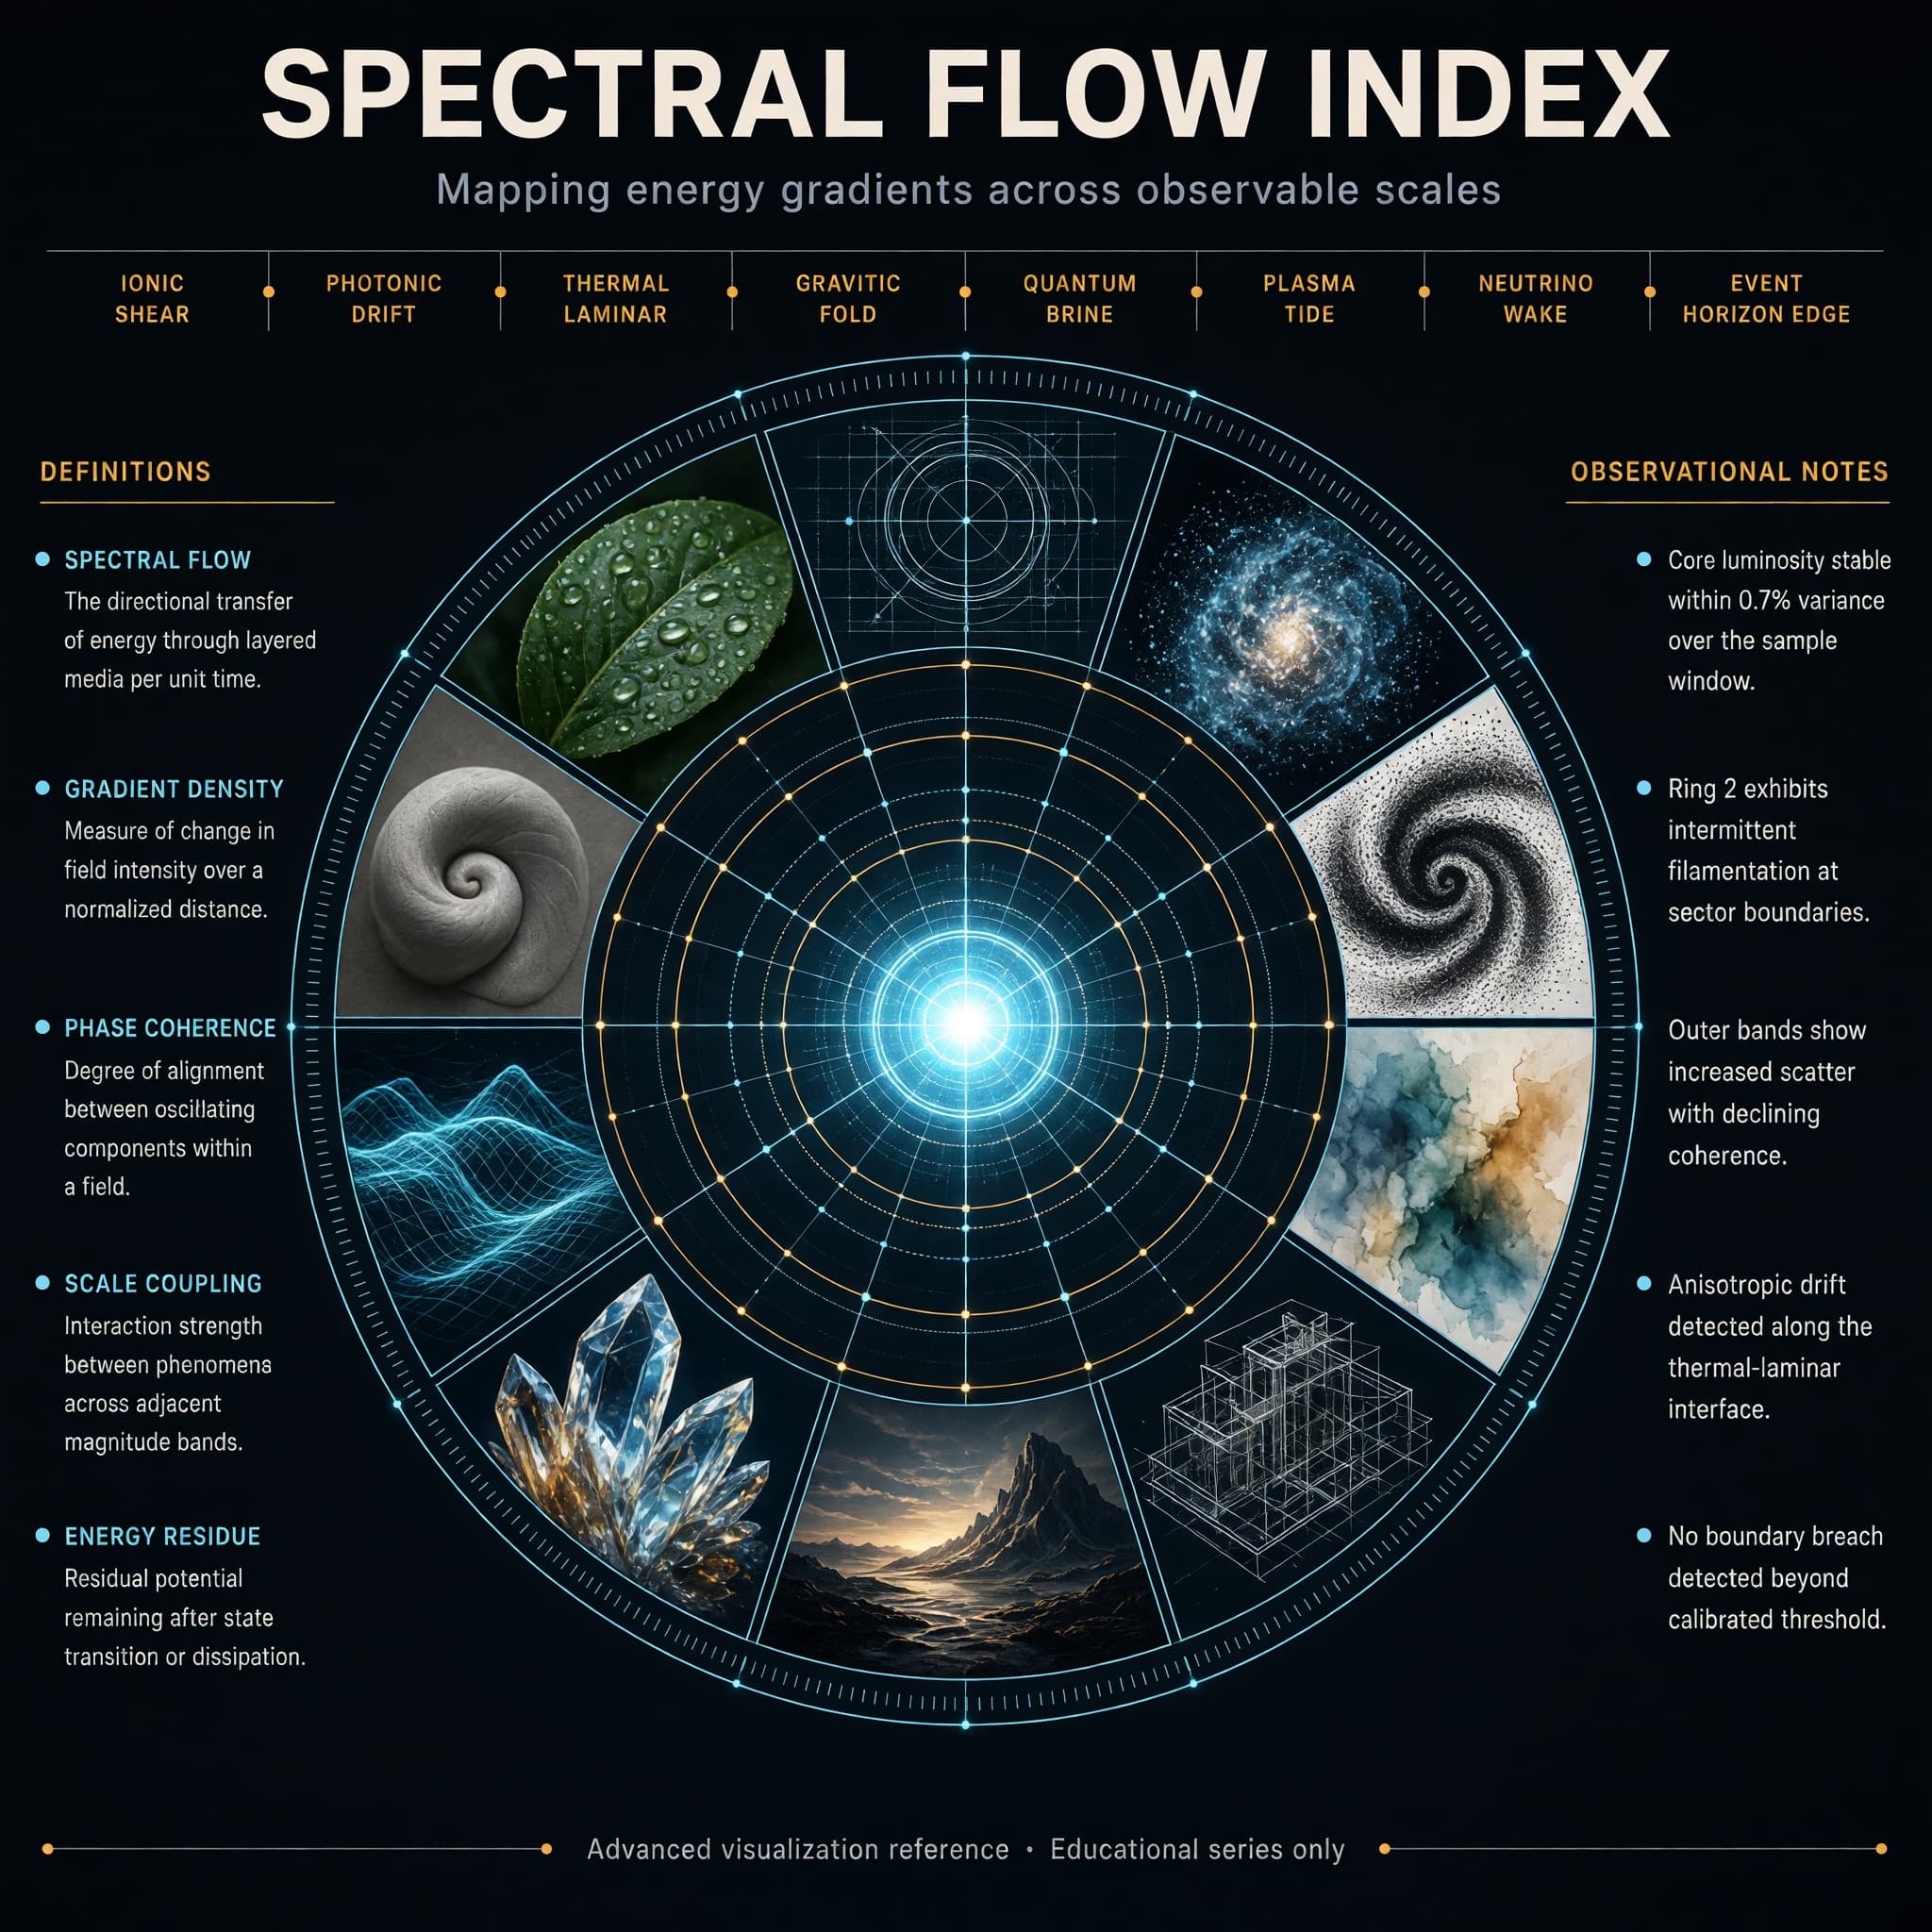
AI-generated Concentric Ring Data Infographic made with Grok Imagine Image 2.0

Concentric Ring Data Infographic

Grok Imagine Image 2.0· 画像
Create a high-end hero infographic titled “SPECTRAL FLOW INDEX”. Design it as a large circular radial diagram with a bright central glowing core, surrounded by five clean concentric rings expanding outward like a precision instrument dial. Each ring is divided into evenly spaced segments containing miniature visual studies rendered in distinctly different styles: photorealism, blueprint linework, volumetric particle render, ink stipple, soft watercolor, isometric technical drawing, cinematic still, macroscopic crystal close-up, luminous wireframe, and matte clay sculpture. The overall atmosphere is electric, refined, and extremely polished — deep charcoal background, subtle luminous cyan and soft amber accents, thin glowing guide lines, and perfect geometric alignment. Typography is dense, hierarchical, and perfectly legible with sharp edges and straight baselines: Large precise bold sans-serif title centered at the very top Medium-weight subtitle directly beneath it: “Mapping energy gradients across observable scales” A clean horizontal band of eight short, evenly spaced labels in sharp small caps across the upper third, naming invented measurement zones Two tall vertical columns of text, one on the far left and one on the far right, each containing five tightly spaced entries in clear body text (definitions on the left, observational notes on the right) A single thin full-width footer line at the very bottom in micro but still razor-sharp text: “Advanced visualization reference · Educational series only” All text sits on straight horizontal or vertical axes. No curved or circular text. Consistent spacing, strong visual hierarchy, and absolute clarity at every scale.
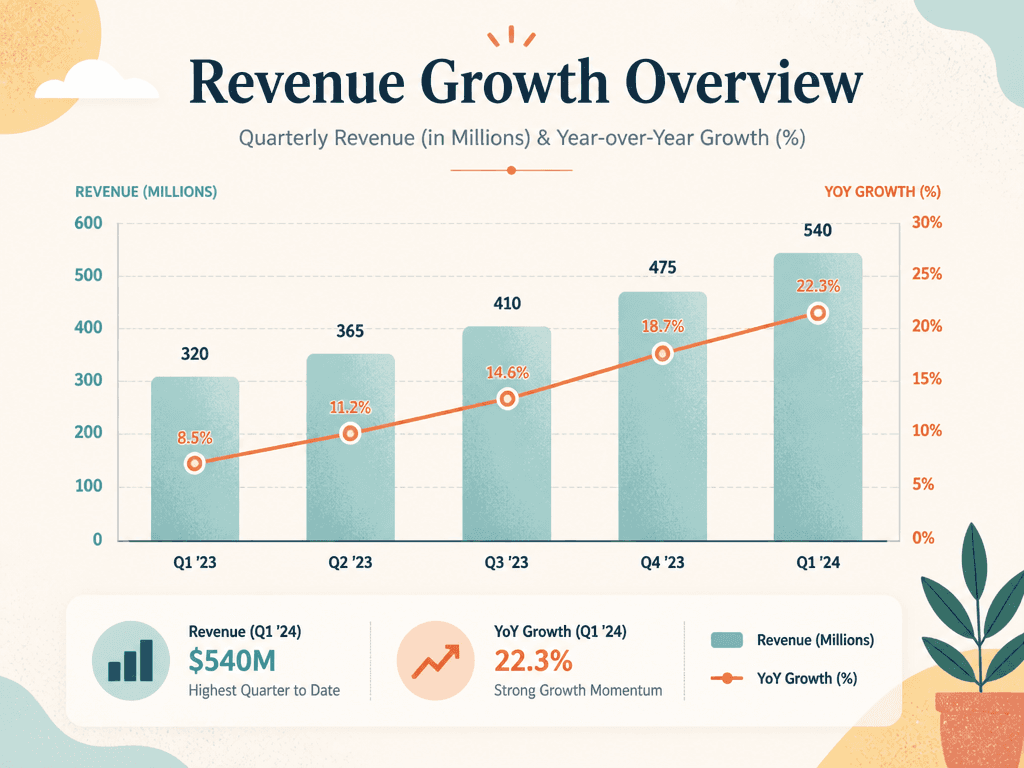
AI-generated Chart Graphic made with GPT Image 2

Chart Graphic

GPT Image 2· 画像
A polished chart graphic for presenting data clearly, combining a bar chart, a line trend, and a compact legend in a modern editorial layout. textured digital illustration, tasteful grain, balanced composition, distinctive shape language. front-facing centered composition with generous padding. soft pastel palette with warm highlights. Make the subject immediately recognizable at thumbnail size. Use clean composition, purposeful details, and no watermark. Choose the medium intentionally; do not default to any single decorative style.

What are chart graphics prompts?

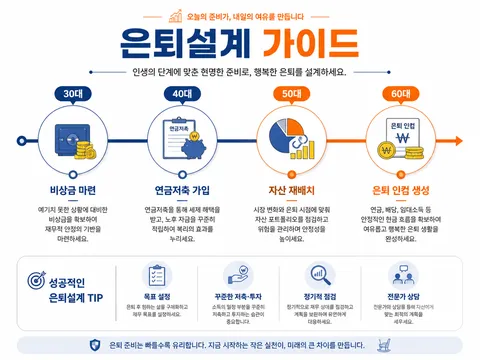
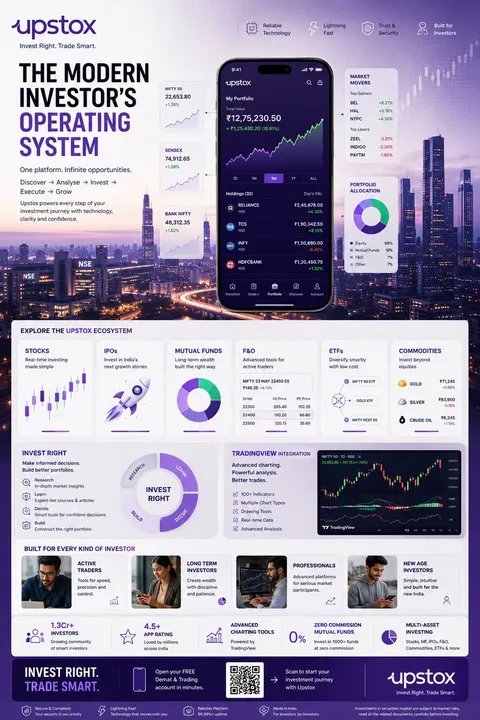
Chart graphics prompts turn numbers and performance metrics into visual explanations that people can understand quickly. They can describe revenue, traffic, conversion rate, survey results, or campaign performance as bar charts, line charts, donut charts, comparison tables, or compact dashboards. A useful prompt should define the time period, units, labels, values, visual hierarchy, color system, and final publishing context instead of asking for a generic chart. If you provide real data, keep the source table nearby and verify every number in the generated image before publishing.

Practical use cases

  • Monthly revenue reports and year-over-year growth summaries
  • Survey results and audience breakdowns for social cards
  • Campaign dashboards comparing clicks, reach, and conversions
  • Educational graphics explaining trends and statistics
  • Newsletter and blog visuals that summarize a complex result

How to structure the visual

A strong chart graphic guides the viewer from the headline to one main insight and then to supporting details. Use one accent color for the key metric and quieter colors for comparison data. State the time period and units near the axes, keep the legend separate from the plotted marks, and leave enough padding for small screens. A 16:9 layout works well for presentations, while square or portrait layouts are useful for social media. Ask for readable labels and restrained decoration so the chart remains informative rather than becoming a poster with tiny text.

More related prompts

Prompt tips

  1. Include the period, categories, units, and source values.
  2. Choose a chart type that matches the comparison you need.
  3. Identify one primary metric and one accent color.
  4. Specify the aspect ratio, title area, legend position, and intended platform.
  5. Compare the final labels and values with the original data before use.

Accuracy should come before decoration. Preserve the source table, add a date or source note when appropriate, and treat the generated visual as a draft that still needs a factual review.
よくあるご質問