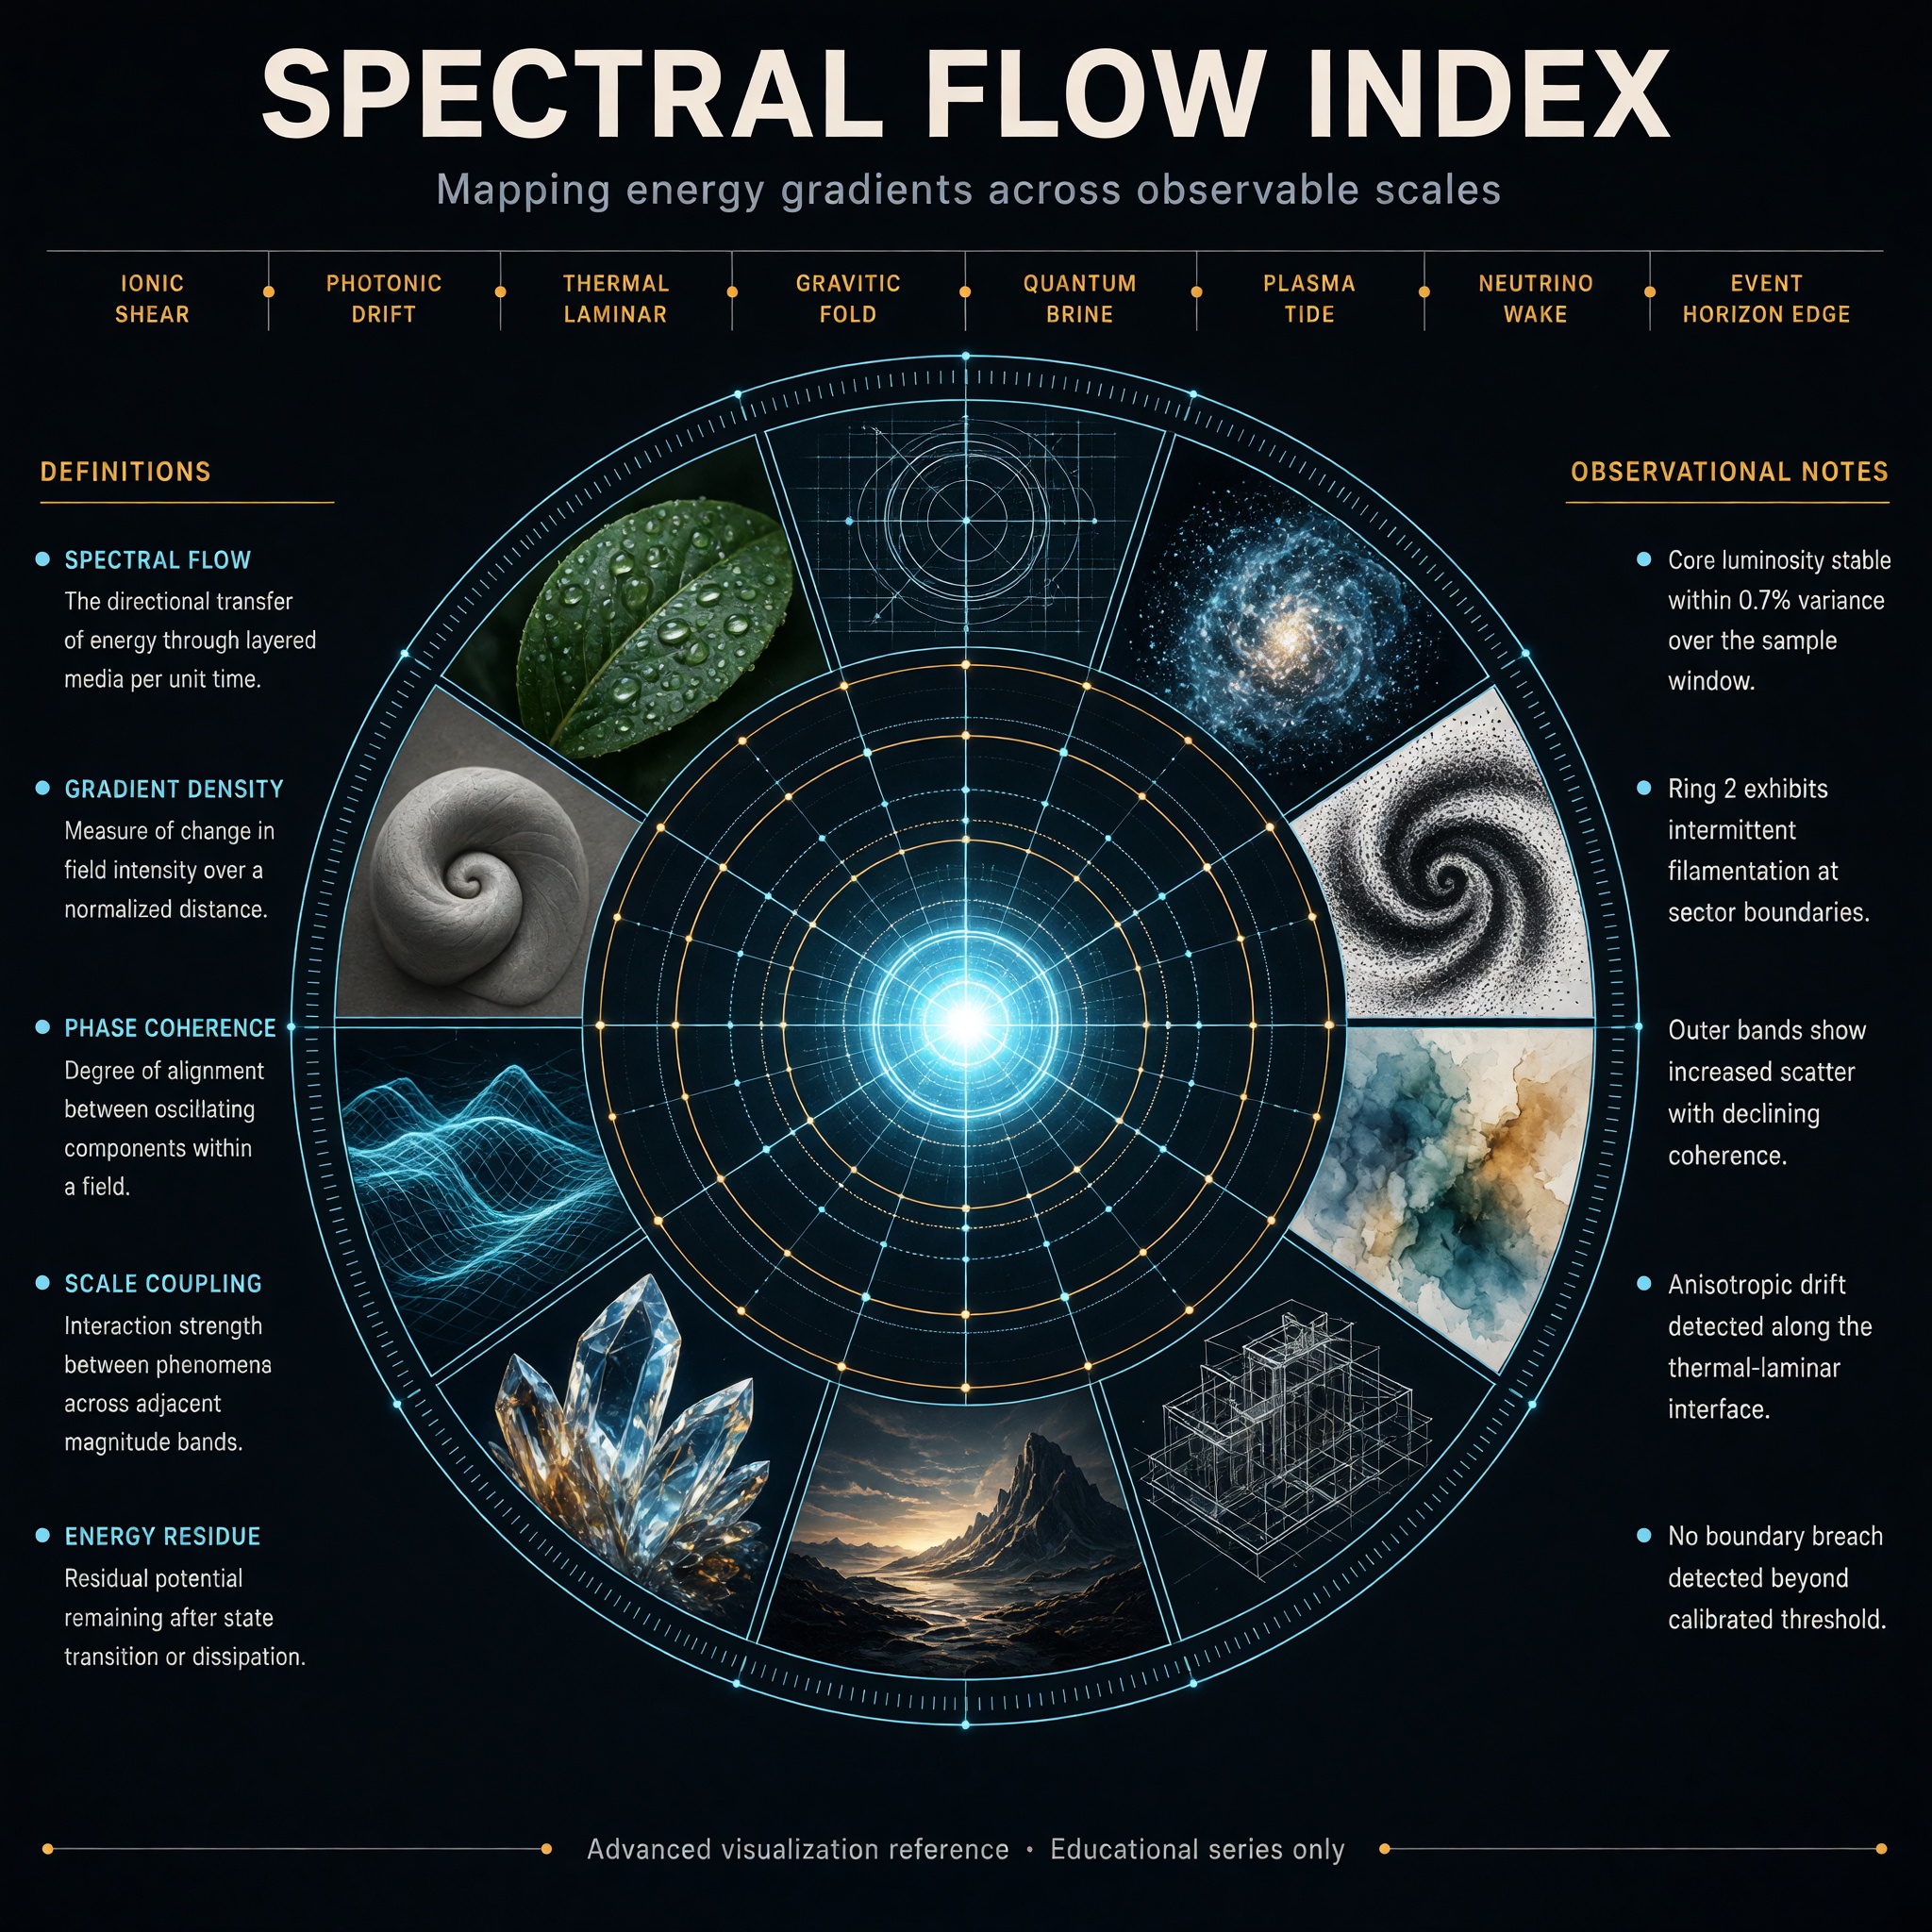
Process Infographic
Create AI prompts that turn complex workflows and procedures into clear, numbered process infographic layouts.
2026.07.17
把「Process Infographic」做成你想要的样子做一个你自己的「Process Infographic」
用大白话说出来就行——Carat 会为你生成合适的图片和视频。

每天 100 免费积分,现在就开始
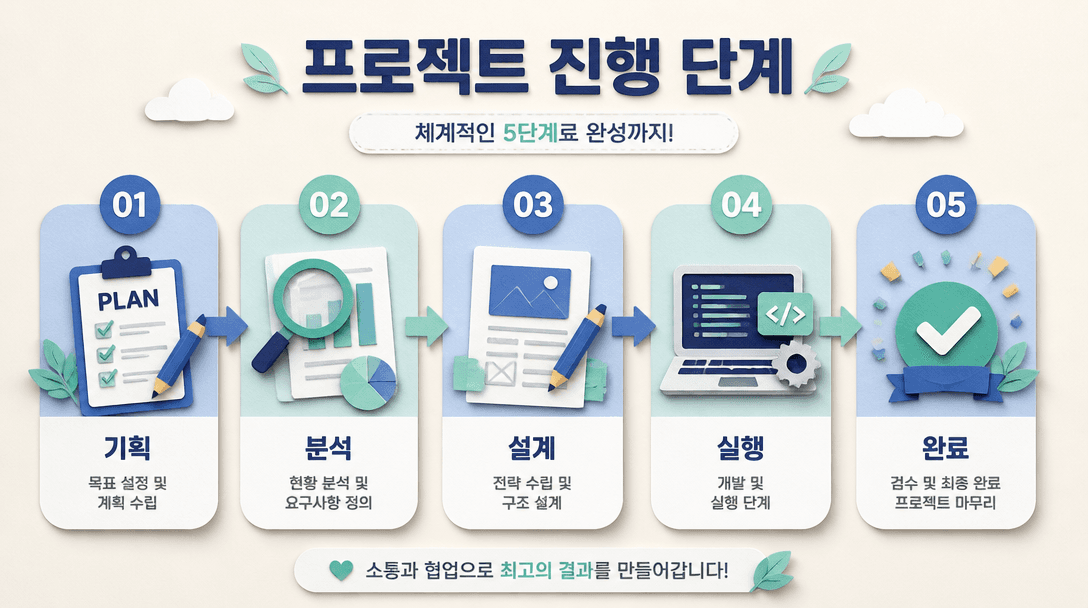
과정 인포그래픽
What are process infographic AI prompts?
Process infographic AI prompts visualize a workflow from beginning to end with numbered steps, arrows, icons, and short explanations. They are useful for product instructions, onboarding, educational lessons, project roadmaps, customer journeys, production flows, and campaign plans. Instead of presenting a long paragraph, the prompt assigns a clear visual role to each step so viewers can understand what happens next. You can adapt the same structure by changing the number of steps, direction, palette, density, and tone for a presentation, social post, manual, or mobile card.
Common use cases
- Product and service instructions
- Internal workflows and onboarding
- Lessons, campaigns, and project stages
- Production, delivery, and fulfillment flows
- Customer application and support procedures
What to specify in the prompt
State the total number of steps, the starting point, and the final outcome. Give every step a short title, one-line explanation, icon idea, and expected result. Define whether the layout should read left to right, top to bottom, or in a loop. Similar text lengths create a more balanced composition, while action-led titles help viewers scan the sequence quickly. Also specify the target platform, ratio, and approximate information density.
Improve clarity and hierarchy
A process infographic must make the relationship between steps obvious. Use contrast between the background, numbered nodes, and connecting arrows. A distinct color or shape for the first and final nodes can reinforce the beginning and outcome. Blue and mint can create a friendly educational mood, while layered paper textures or soft shadows add depth without replacing the structure. Keep numbers and connector lines crisp, especially when the image will be viewed as a small thumbnail.
Review before publishing
Small labels and numbers may contain mistakes, so compare every step with the source workflow. For real business instructions, verify owners, deadlines, exceptions, and required documents. Check the image on a mobile screen and make sure the first and last steps remain easy to identify. If the workflow is too dense, split it into several cards or create a summary version. Specific instructions about purpose, audience, steps, direction, ratio, and hierarchy make the result more reusable.