carat

Prompt Gallery

/

Weather Chart Prompts

Weather Chart Prompts

Practical weather chart prompts examples for clear visual design.

2026.08.13

Make “Weather Chart Prompts” exactly the way you wantCreate your own “Weather Chart Prompts”

Just ask in plain language — Carat generates optimized images and videos for you.

Start now with 100 free credits daily
·
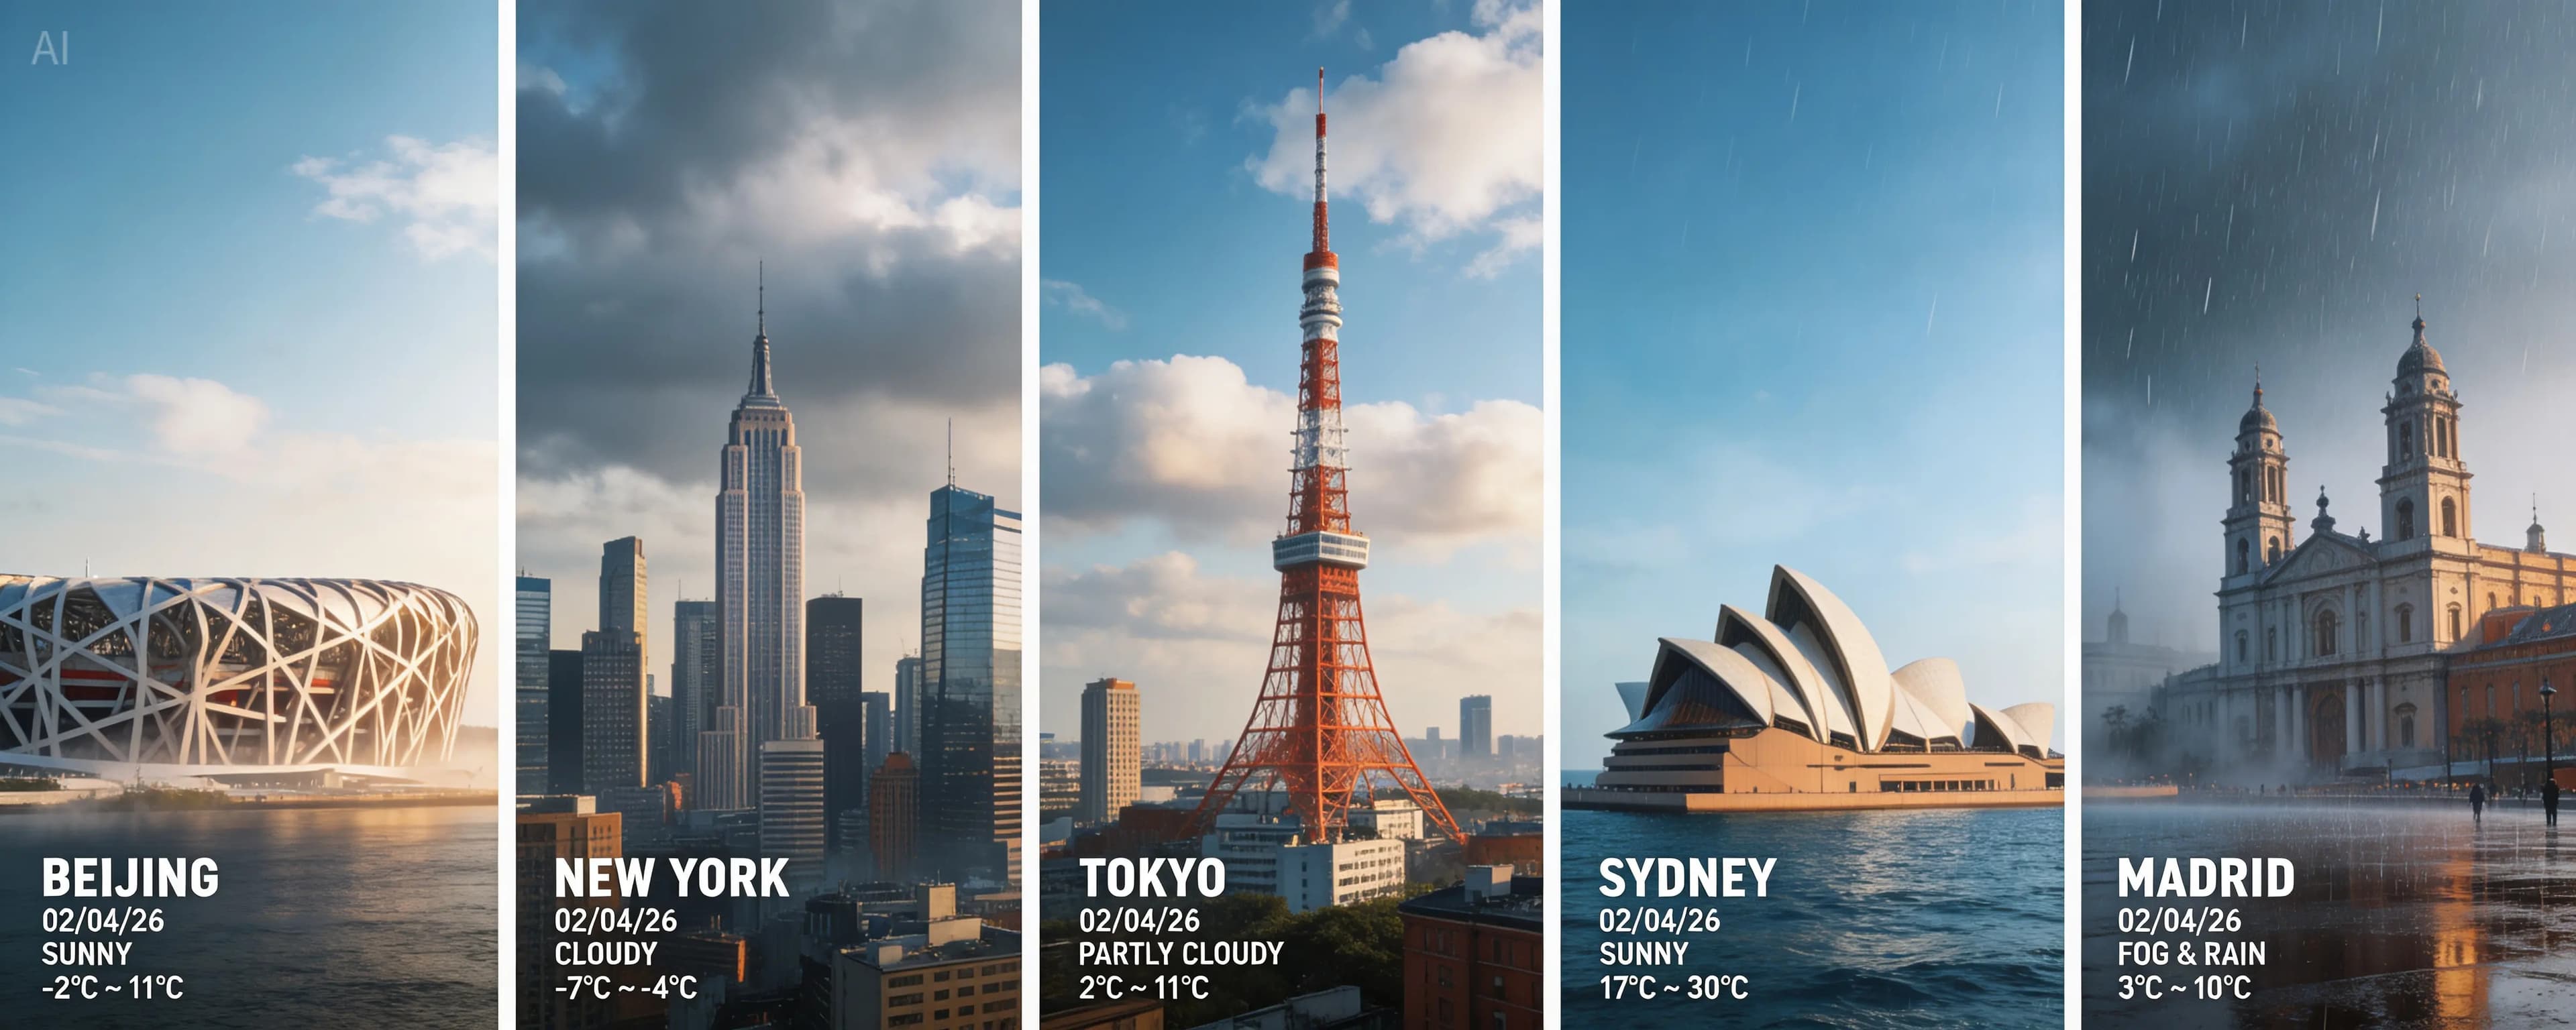
AI-generated World Cities Real-Time Weather Composite made with Seedream 5.0 Lite
World Cities Real-Time Weather Composite

Seedream 5.0 Lite· Image
Search for the weather, temperature, and time for the following locations: Beijing, New York, Tokyo, Sydney, Madrid. High-concept composite photography. The image is composed of five seamlessly stitched vertical panoramic strips, each presenting the real-time weather and lighting of a specific location (a landmark building per city), unified with cinematic color grading despite different weather conditions. High contrast, 8K resolution, photorealistic masterpiece.
AI-generated Weather Graphics made with GPT Image 2

Weather Graphics

GPT Image 2· Image
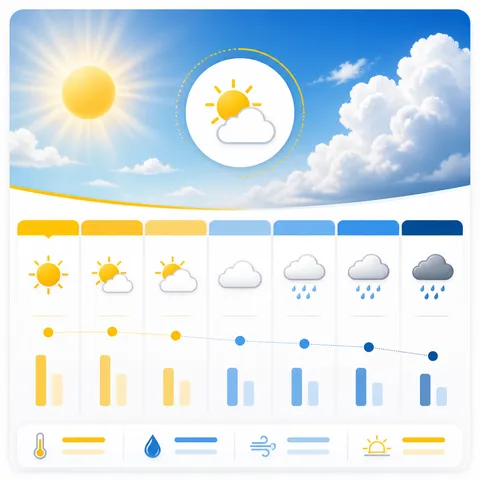
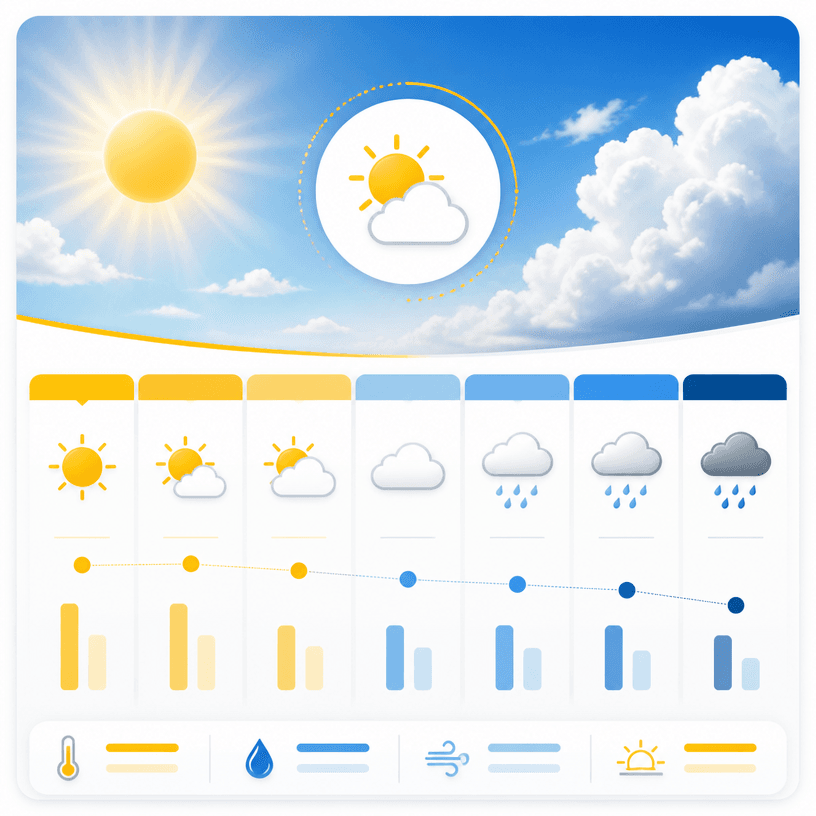
A clear modern weather infographic design showing a sunny-to-rainy weekly forecast concept with simple weather icons, blue sky and warm yellow accent palette, clean editorial information layout, subtle grid, polished square composition, no readable text, no logos, no watermark.
AI-generated Seasonal Weather Notice made with GPT Image 2

Seasonal Weather Notice

GPT Image 2· Image
A polished square seasonal weather notice template for rainy season guidance, soft blue and mint palette with gentle raindrops, umbrella and cloud motifs, a large clean blank panel reserved for Korean weather guidance, clear public-information graphic, no readable text, no logos, no watermark.

Weather Chart Prompts are practical prompts for designing clear visual schedules, lists, and charts. Define the audience, purpose, content hierarchy, layout, aspect ratio, palette, typography, icon language, and editable areas. Separate fixed system rules from changing content so a series stays consistent. Use concrete visible details instead of vague quality claims, and keep decorative elements subordinate to the information. Specify whether the output is for mobile sharing, print, presentation, a dashboard, or a production board, because each format needs different spacing and density. Review the result at its final size, check labels and units, and refine one layout variable at a time. These examples can be adapted to creative production, event planning, education, travel, and operational workflows.

Frequently Asked Questions