Create a fishbone diagram that organizes possible causes into clear, testable categories.
2026.07.16
Make “Fishbone Diagram” exactly the way you wantCreate your own “Fishbone Diagram”
Just ask in plain language — Carat generates optimized images and videos for you.

Start now with 100 free credits daily
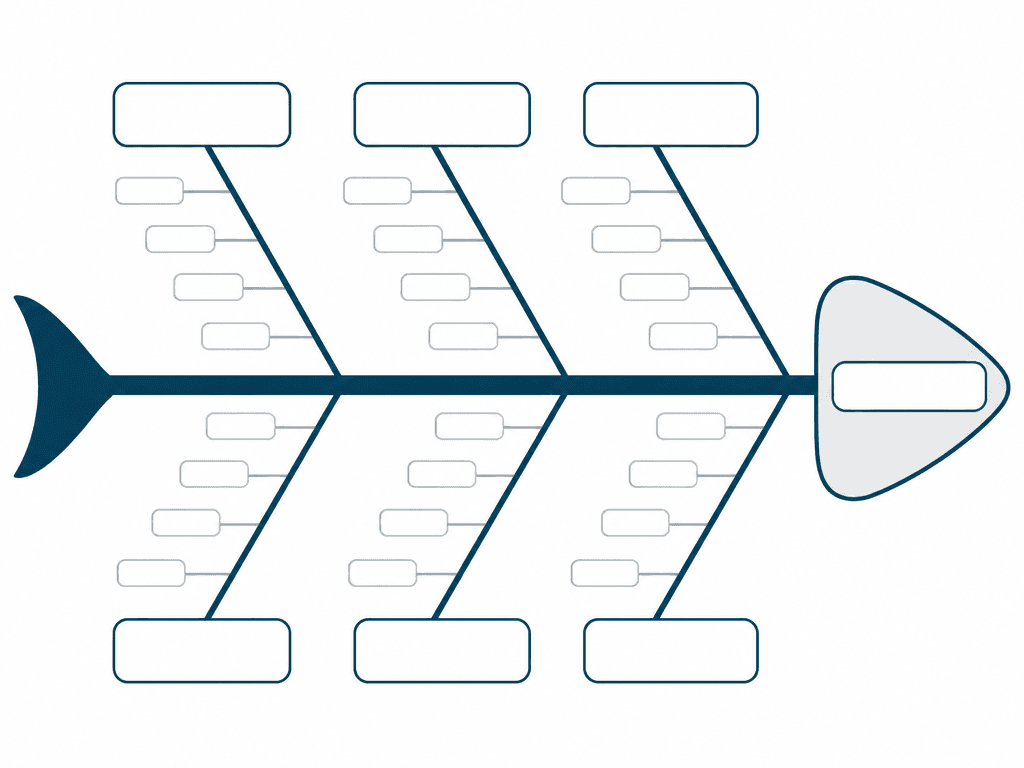
Define the effect in one sentence at the fish head, including the period, audience, and conditions. Keep proposed solutions out of the problem statement so the team studies the same event. Bring observations and reliable data to the session, and label unsupported claims as hypotheses.
People, methods, equipment, materials, environment, and measurement are starting categories rather than mandatory labels. Replace them with journey, policy, tools, or channels when those fit the subject. Put one category on each major branch and one specific possible cause on each smaller branch, merging duplicates.
Ask participants to write causes independently, cluster similar notes, and review evidence before voting. Repeat why questions without blaming individuals; describe processes and operating conditions. Rank causes by impact and testability, then record an owner and a validation date outside the diagram.
Keep branch angles, line weights, label sizes, and spacing consistent. Do not rely on color alone to distinguish categories. Shorten long sentences into precise phrases, leave room for editing, and test small branches in screen sharing and print. Add verified text as editable layers instead of generating it inside the image.
Connect the completed diagram to a validation plan. Track the data source, test method, owner, and status for each priority cause in a separate table. Review whether correlation has been mistaken for causation, invite missing stakeholders, preserve version history, and share only after the team agrees on the next test.