Flowchart Design
Visualize complex data and business workflows with professional AI-generated flowchart designs.
2026.07.04
Make “Flowchart Design” exactly the way you wantCreate your own “Flowchart Design”
Just ask in plain language — Carat generates optimized images and videos for you.

Start now with 100 free credits daily
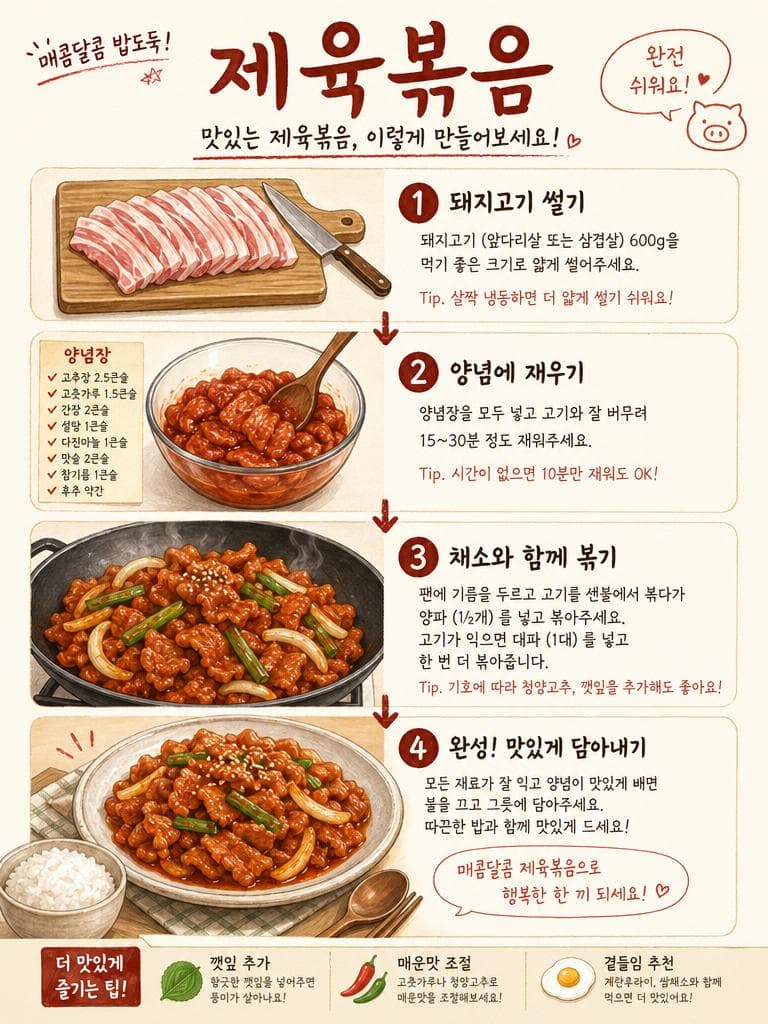
Jeyuk Bokkeum Recipe Flowchart
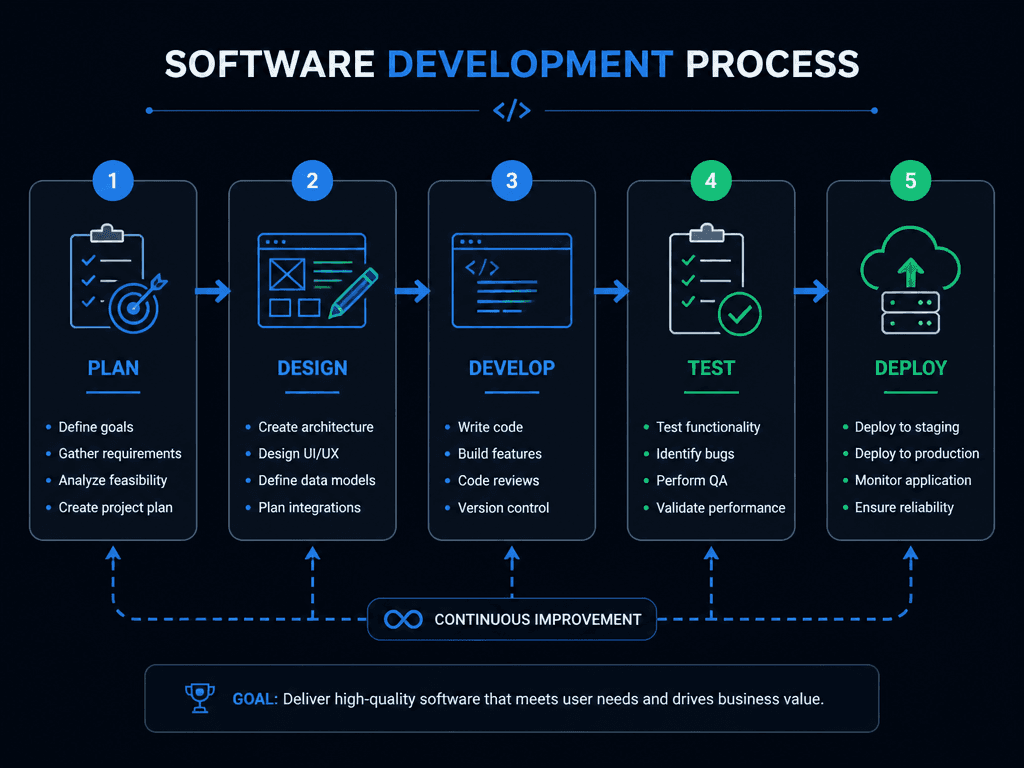
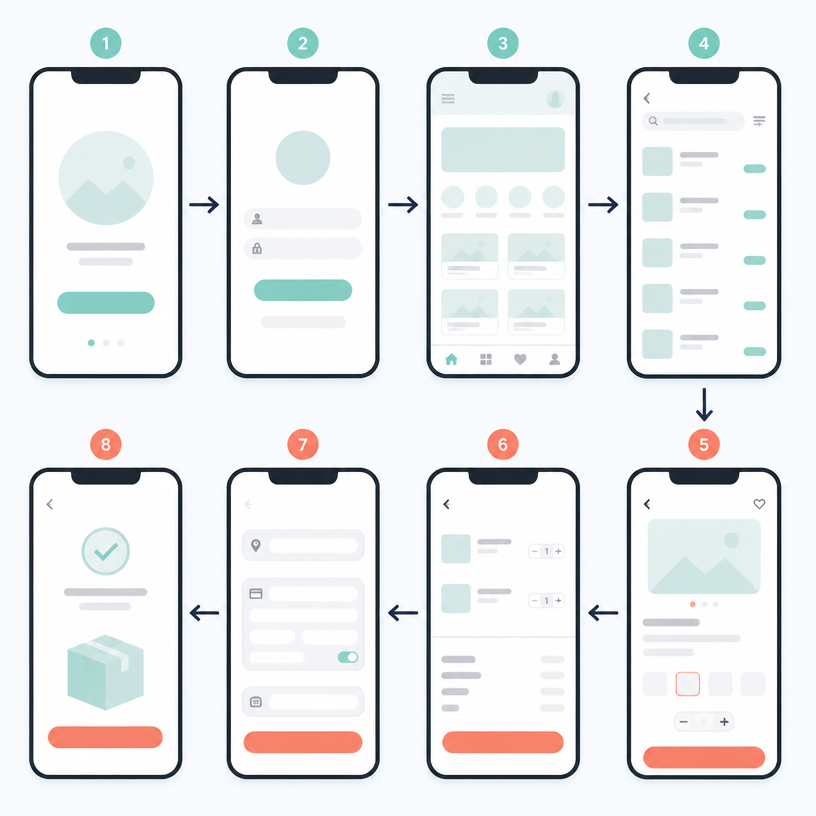
소프트웨어 개발 플로우
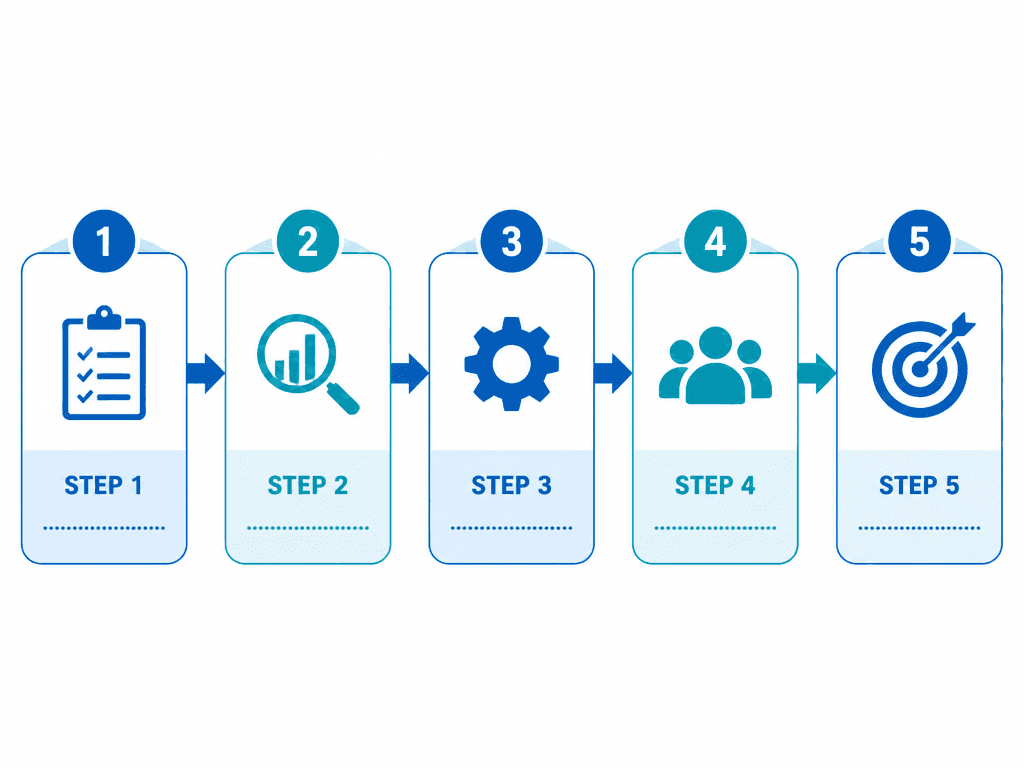
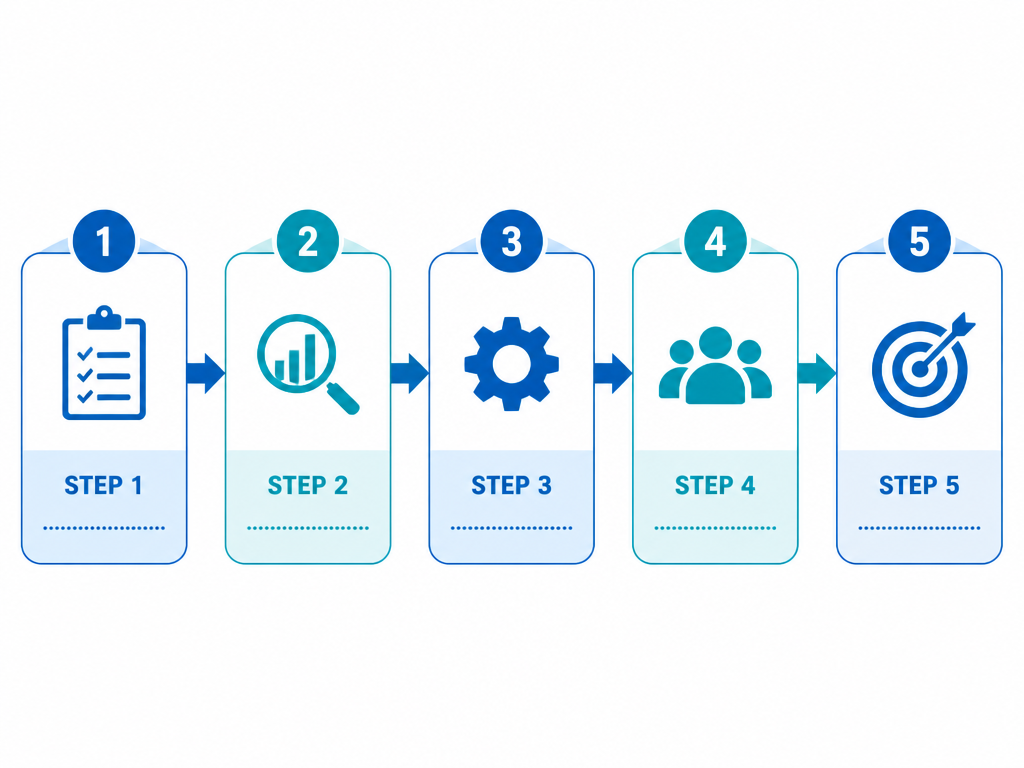
업무 프로세스 플로우
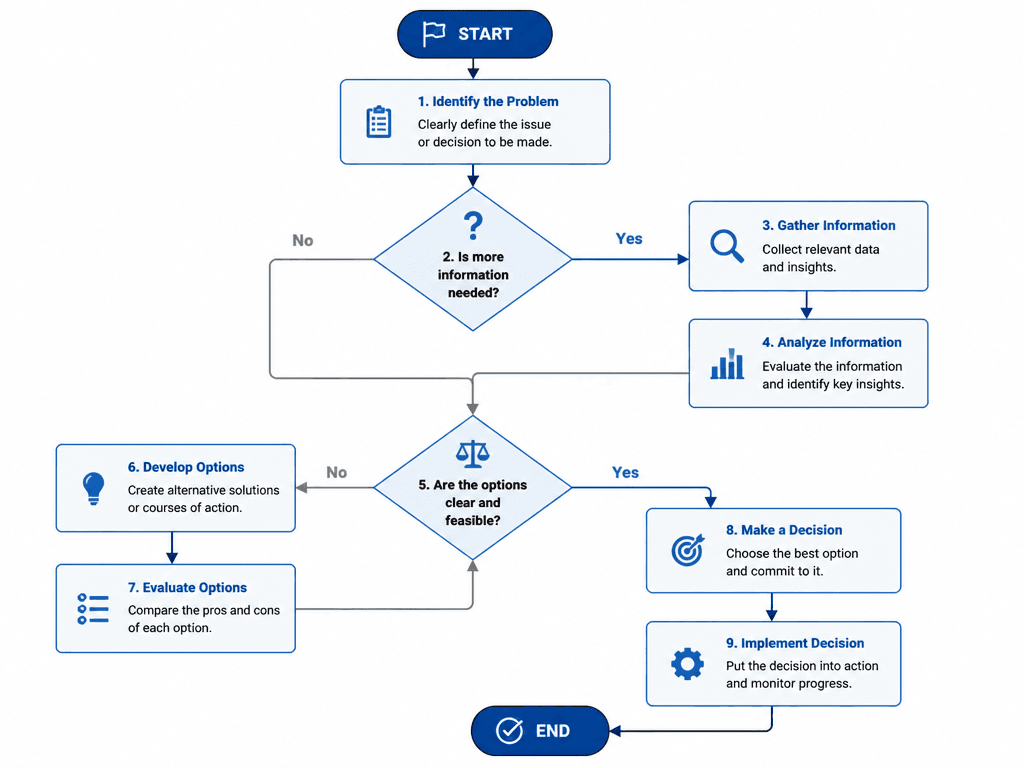
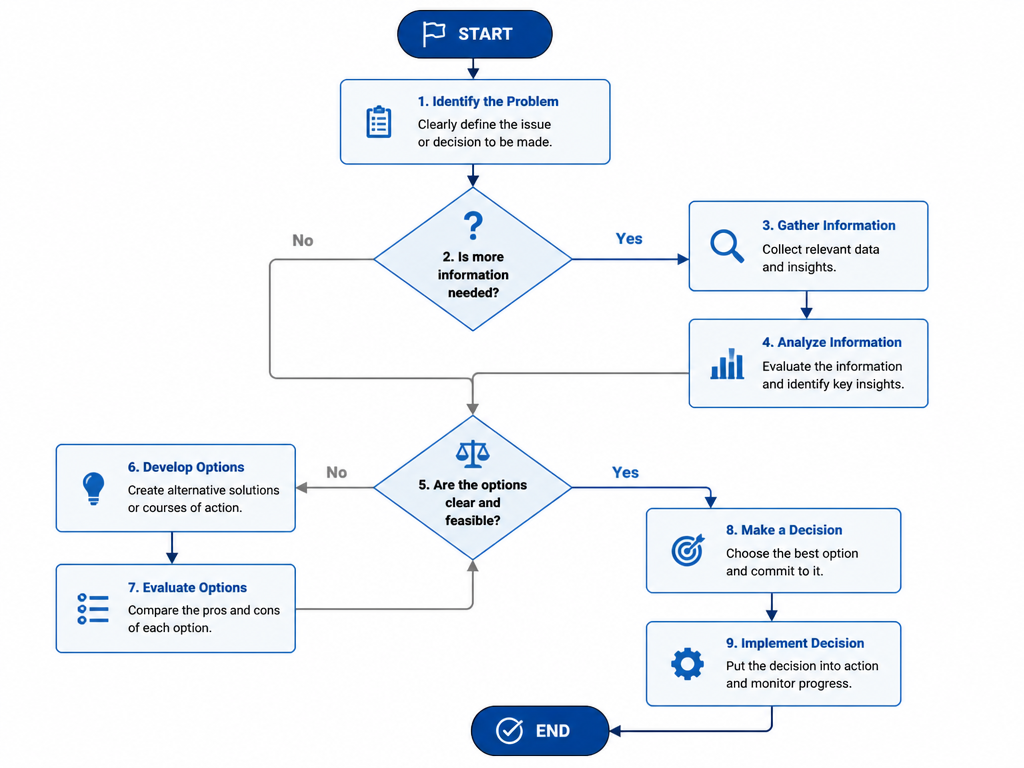
의사결정 플로우차트
What Are Flowchart Design AI Prompts?
Flowchart Design AI prompts are specialized sets of linguistic instructions designed to guide AI models in generating visually structured diagrams that represent processes, systems, or workflows. These prompts go beyond simple shapes; they focus on the logical arrangement of information, using boxes, arrows, and icons to create a coherent narrative of data flow. Whether it is a complex software development lifecycle, a business decision tree, a step-by-step cooking recipe, or a marketing funnel, these prompts provide the blueprint for the AI to visualize causal relationships and sequential steps. By defining the style, color scheme, and structural orientation, users can generate high-quality infographics that make complex information immediately accessible and visually appealing.
Best Use Cases
The utility of Flowchart Design prompts spans across numerous professional and creative fields. In the business world, they are indispensable for creating polished presentation slides that explain organizational hierarchies or operational procedures. Project managers use them to visualize task dependencies and project timelines clearly. For software engineers and UI/UX designers, these prompts help in sketching out system architectures or user flow maps before moving to high-fidelity prototyping. They are also incredibly popular for educational purposes, helping students and teachers break down difficult concepts into digestible visual steps. In social media marketing, flowcharts are often used as "educational carousels" to provide value to followers by explaining complex topics in a simplified, visually engaging format. From a simple "choose your own adventure" flowchart to a detailed technical blueprint, the use cases are virtually limitless.
Why This Tag Works
The Flowchart Design tag is effective because it bridges the gap between raw information and graphic design. It leverages the AI's ability to understand spatial logic and hierarchical structures, allowing users to generate professional-grade layouts without needing advanced design software skills. This tag ensures that the resulting diagrams are not just functional but also aesthetically consistent. By providing a framework for "clean lines," "balanced spacing," and "meaningful color coding," it helps maintain a high standard of visual communication. It also allows for rapid iteration; a user can change the theme of a flowchart from "classic corporate" to "hand-drawn creative" in seconds just by adjusting a few words in the prompt. This efficiency makes it an essential tool for anyone who needs to present information in a structured, professional, and engaging manner.
Explore Related Prompts
Enhance your data visualization projects by exploring these related prompt categories:
- Data Infographic : Turn raw numbers into beautiful, insight-driven visuals.
- Process Diagram : Focus specifically on the sequential steps of a system or task.
- Timeline Diagram : Visualize the progression of events or milestones over time.
- Blueprint Design : Achieve a technical, engineering-inspired look for your diagrams.
- Card News Template : Adapt your flowcharts into snackable social media content.
- Illustration : Create custom icons and background elements for your diagrams.
- Cinematic Video : Plan how to animate your process flows for high-impact presentations.
Prompt Building Tips
To build a successful flowchart design prompt, start by defining the "logical orientation." Use terms like "top-down hierarchy" or "left-to-right linear flow" to give the AI a clear structural starting point. Next, describe the visual style of the elements: "rounded rectangles with soft shadows," "crisp vector arrows," or "minimalist flat icons." Color choice is vital for readability; specify "a professional palette of navy blue and slate grey" or "high-contrast vibrant accents for key steps." Always include environmental instructions like "on a clean, isolated white background" to ensure the diagram can be easily cropped or integrated into other designs. For added sophistication, use modifiers like "mathematical precision," "symmetrical balance," and "high-definition 2D vector graphic." If you need specific content types, mention them, such as "decision-making nodes" or "start and end terminals," to guide the AI toward a more functional output.