Infographic Examples
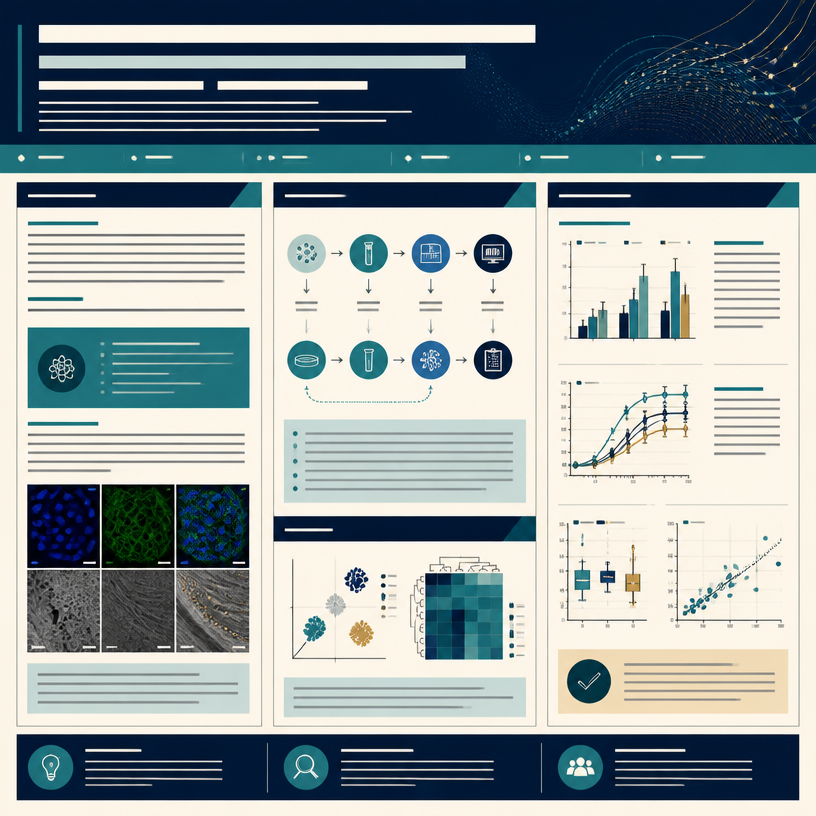
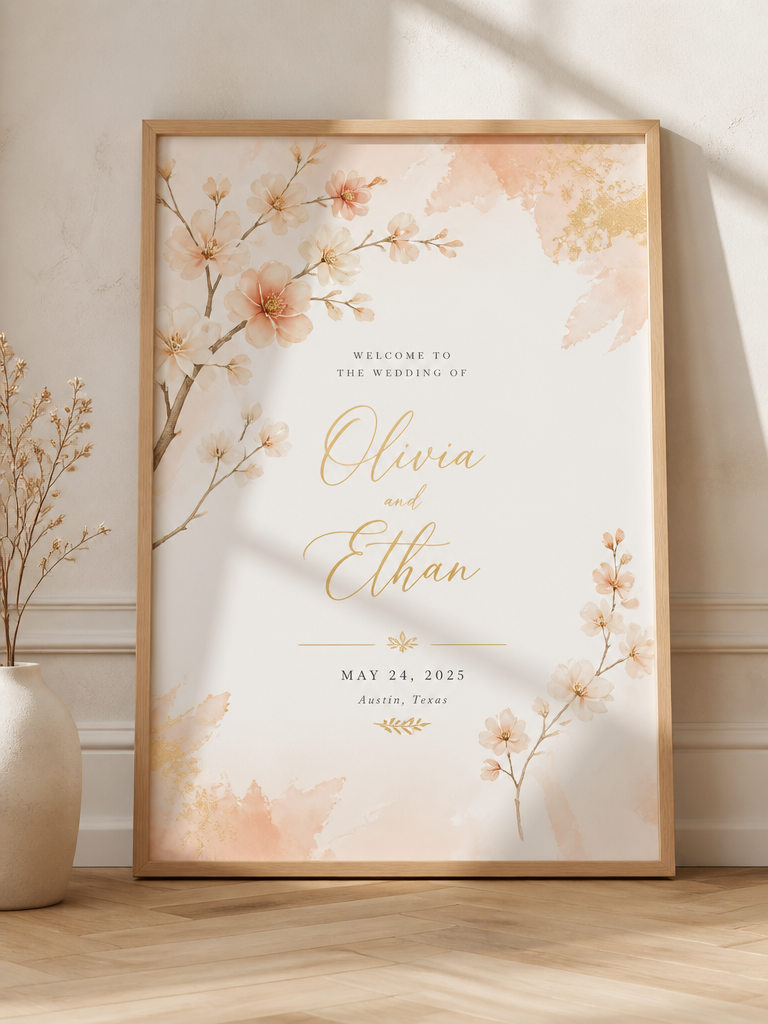
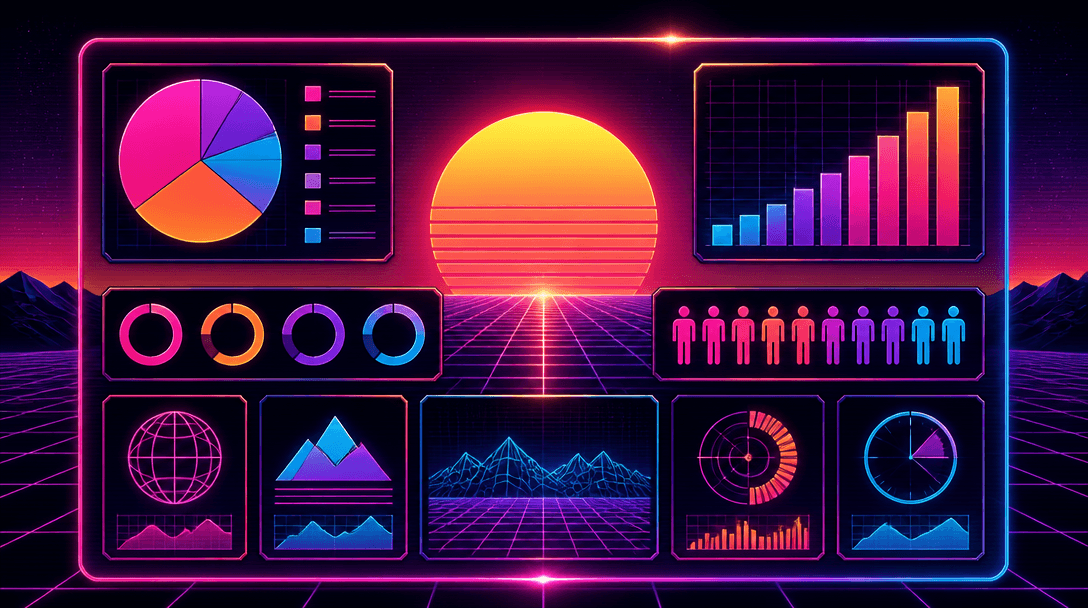
Generate professional infographic designs with various data visualizations and charts.
2026.07.04
Make “Infographic Examples” exactly the way you wantCreate your own “Infographic Examples”
Just ask in plain language — Carat generates optimized images and videos for you.

Start now with 100 free credits daily
인포그래픽 예시
The Infographic Examples prompt is meticulously crafted to empower users to generate sophisticated, high-impact design layouts that transform complex data into clear, visually compelling narratives. In today's information-heavy business and academic landscapes, effective data visualization is a critical skill. This prompt bridges the gap between raw data and professional design, allowing anyone to produce polished charts, graphs, and icon arrangements in seconds. Whether you are preparing a corporate report, a dynamic presentation, an engaging newsletter, or educational social media content, these AI-generated assets provide a powerful foundation for maximum clarity and engagement.
At the heart of every great infographic is the ability to simplify complexity. This prompt utilizes logical spatial partitioning and intuitive color contrasts to guide the viewer's eye toward the most important information. By harnessing AI, you move beyond basic bar charts to secure creative diagrams and integrated illustrations that elevate your message. This prompt specifically incorporates modern design trends like minimalism and flat design, ensuring your visual communication looks contemporary and authoritative.
Key use cases for these infographic assets include: First, visualizing key performance indicators for annual reports or executive briefings. Second, creating instructional aids that explain complex scientific concepts or historical timelines in educational settings. Third, developing shareable social media content for marketing teams to communicate survey results or industry trends. Fourth, designing process flowcharts for service overview pages or 'About Us' sections on corporate websites.
To refine your infographic generation, try these specialized tips. Define the specific theme (e.g., healthcare, finance, sustainable energy) and list the desired visualization elements (e.g., radial charts, interconnected nodes, world maps, or step-by-step processes). Specifying a color palette that aligns with your brand - such as professional blues, energetic oranges, or sophisticated monotones - will ensure brand consistency across all materials. Keywords like 'clean grid system', 'mathematical layout', and 'vector-style illustration' are essential for achieving a high-quality, organized result.
Carat's infographic prompts offer more than just an image; they provide a blueprint for inspiration. While AI is excellent at creating the structure, we recommend generating layouts with minimal text and using graphic tools to overlay your precise data and typography. With full commercial usage rights, these resources enable you to communicate your most valuable insights with professional-grade aesthetics.