KPI Dashboard
Generate AI images with KPI Dashboard prompts.
2026.07.10
Make “KPI Dashboard” exactly the way you wantCreate your own “KPI Dashboard”
Just ask in plain language — Carat generates optimized images and videos for you.

Start now with 100 free credits daily
·
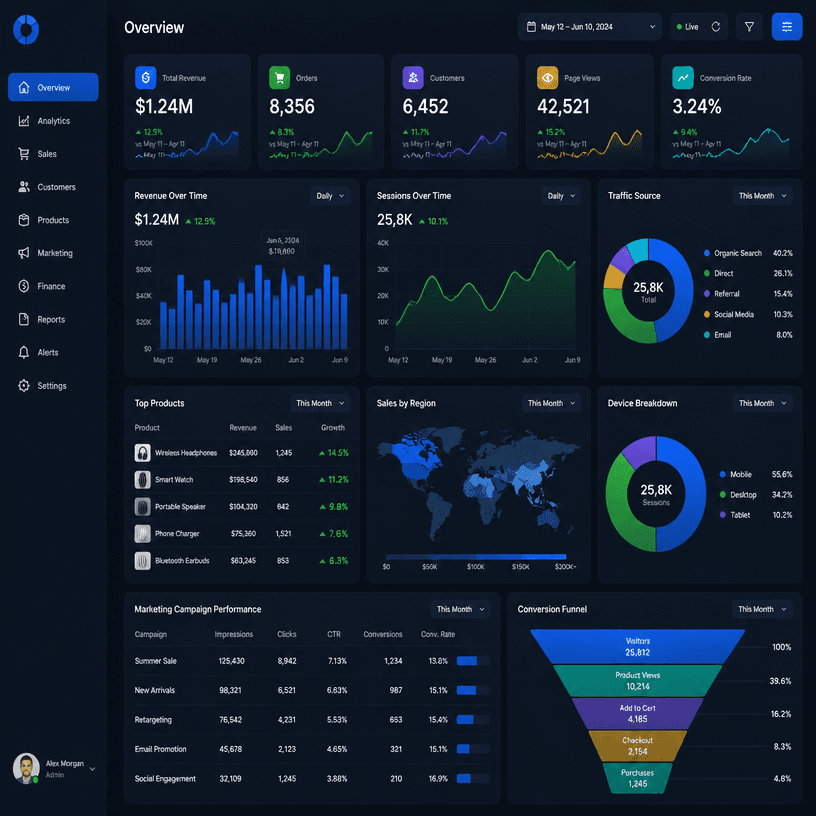
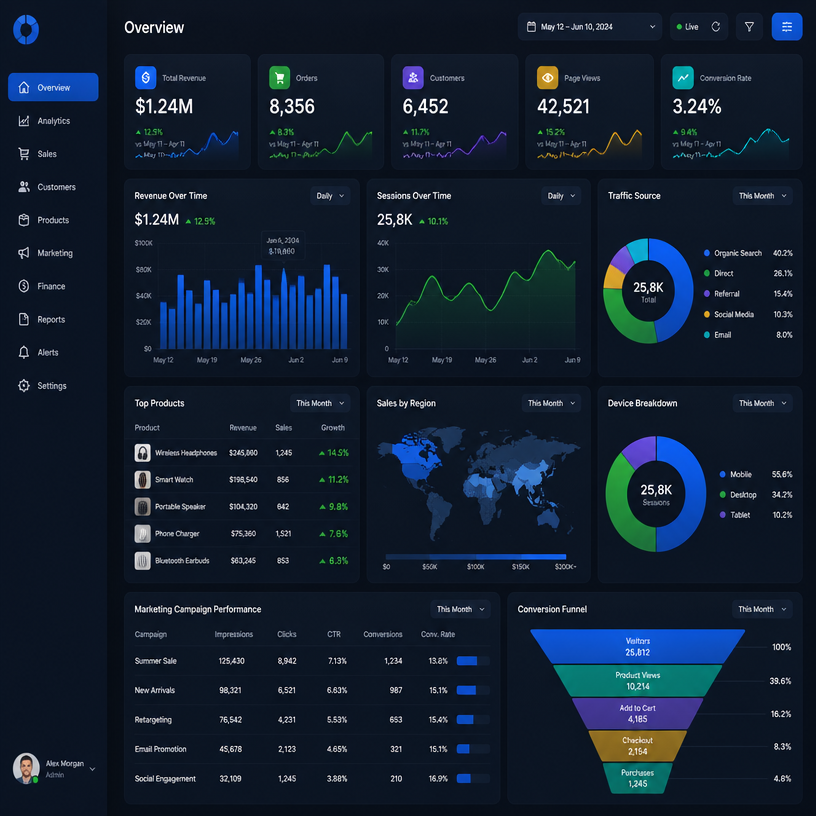
KPI 대시보드
GPT Image 2· Image
A KPI dashboard interface design, multiple data visualization widgets showing bar charts line graphs and pie charts, dark theme with blue and green accent colors, real-time metrics display with percentage indicators, business analytics UI mockup, clean data-driven design aesthetic. No text, no watermark.
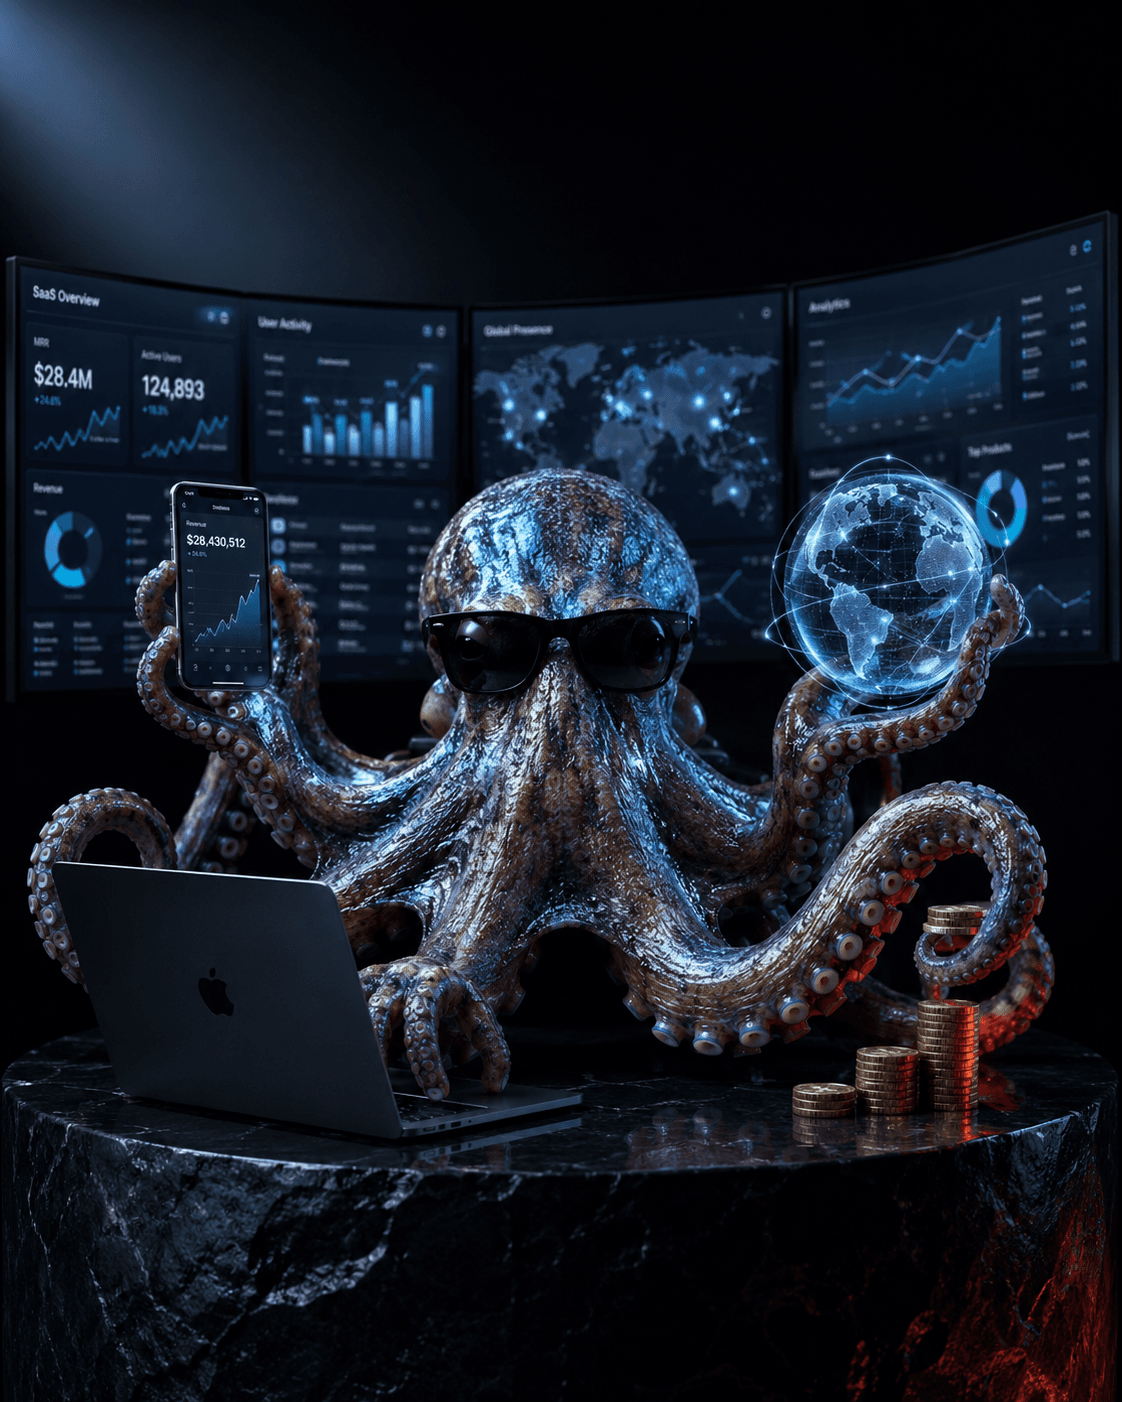
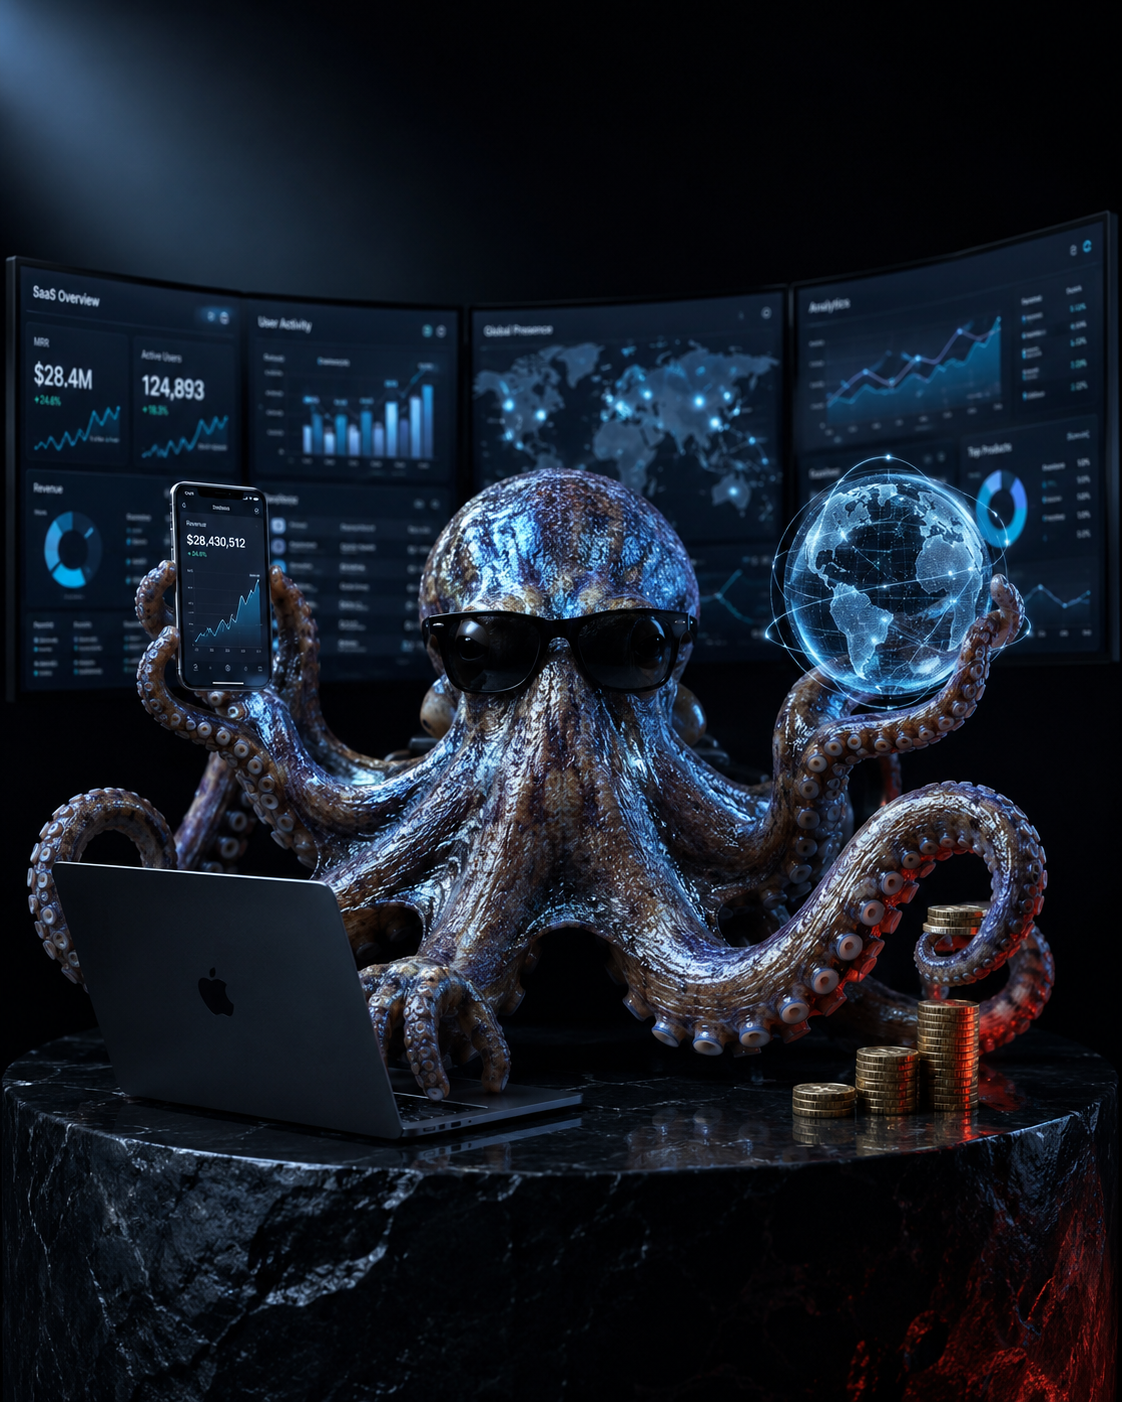
Sunglasses Octopus Studio Photo
GPT Image 2· Image
Hyperrealistic studio photograph of a majestic octopus with iridescent blue-grey mottled skin, wearing sleek minimal black sunglasses, positioned confidently on a glossy black obsidian pedestal in a seated, executive-like pose. Four tentacles each perform a distinct task simultaneously: one typing on a matte-black MacBook laptop, one holding a glowing smartphone displaying an upward revenue graph, one gripping a translucent holographic globe with pulsing connection nodes, one balancing a small stack of gold coins mid-transfer. Behind the octopus, five ultra-thin curved monitor screens arc in a 180-degree semi-circle, displaying SaaS dashboard interfaces, analytics charts, and a world map with glowing user-activity dots. Pure matte black studio background, no clutter, no extra props. Octopus skin rendered with ultra-fine photorealistic texture, subtle wet sheen on the suction cups. Shot on ARRI ALEXA 65 with a 50mm prime lens, shallow depth of field with the subject tack-sharp and the background screens falling into soft bokeh, dramatic single-source cool blue-white rim light from upper left, subtle warm red accent bounce light from lower right (hex ee4650), high-contrast chiaroscuro, glossy obsidian surface reflecting faint screen glow, ultra-detailed, 8k, commercial advertising photography --ar 4:5 --v 6.1 --style raw
What are KPI Dashboard Prompts?
Text instructions for AI image generation.
How to Use
- Copy prompt. 2. Paste into Carat. 3. Modify. 4. Download.
Tips
Specify lighting, texture, composition.
Optimization
Add "No text, no watermark".