Infographic Design
AI prompts for creating visually compelling infographics and data-driven information design.
2026.07.01
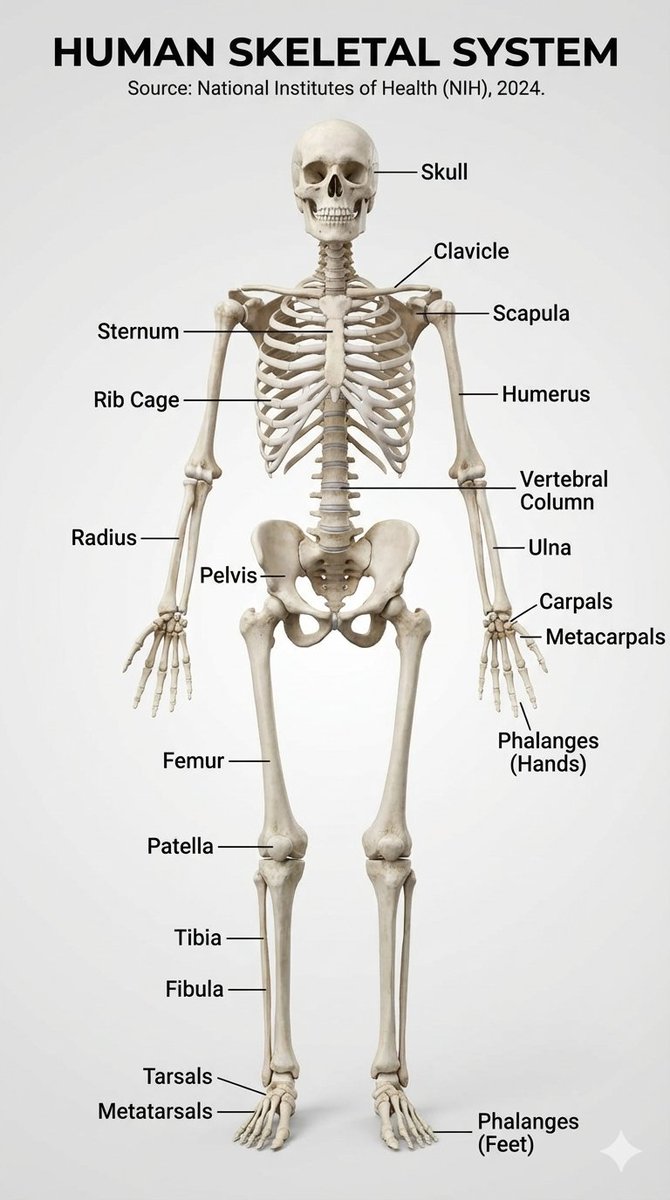
Human Skeletal System Infographic

Museum Atlas-style Korean Detailed Infographic About Joseon Court Dress ( )
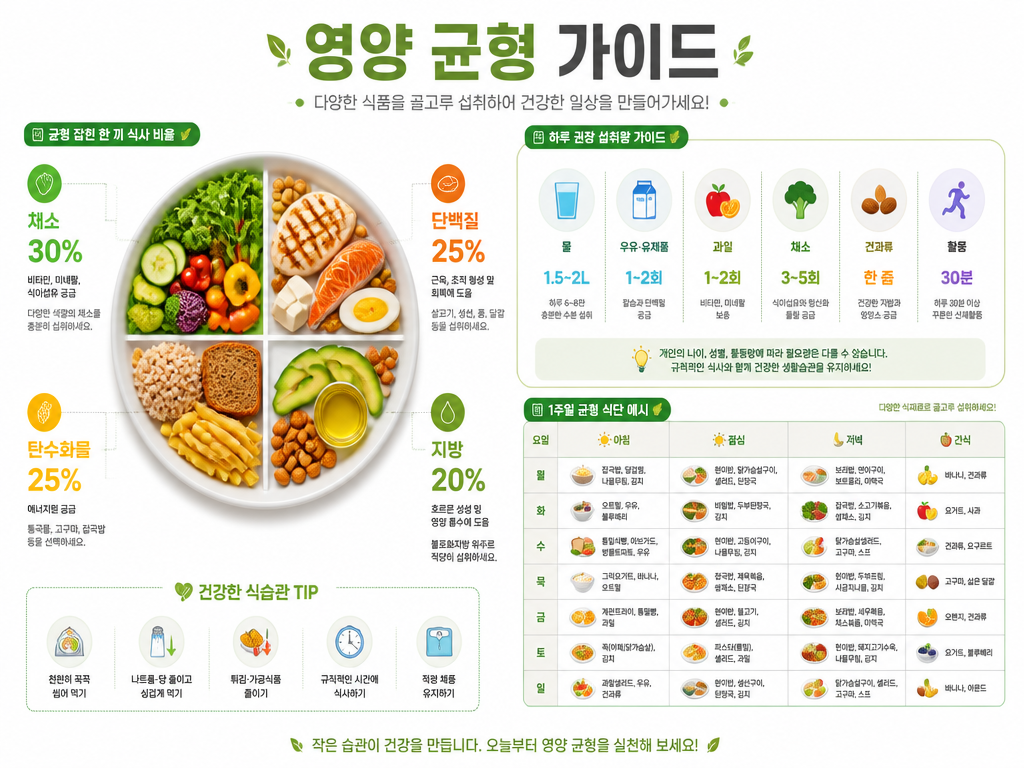
영양 균형 가이드 인포그래픽
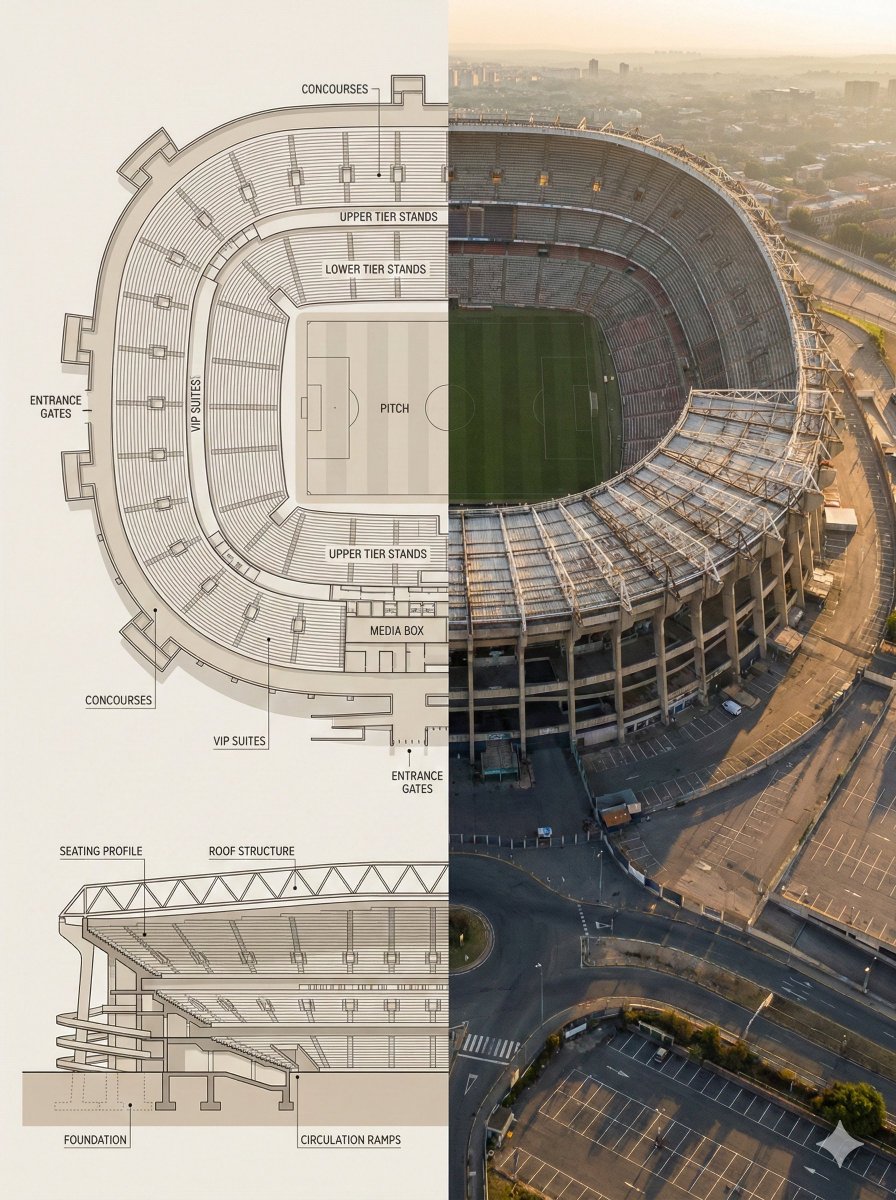
Landmark Floor Plan Cross-Section Infographic
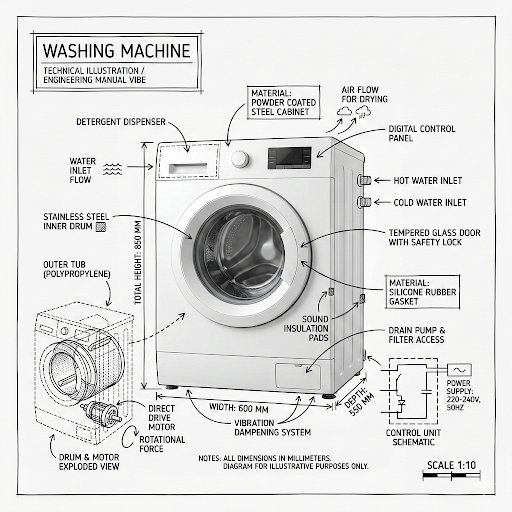
Washing Machine Technical Infographic
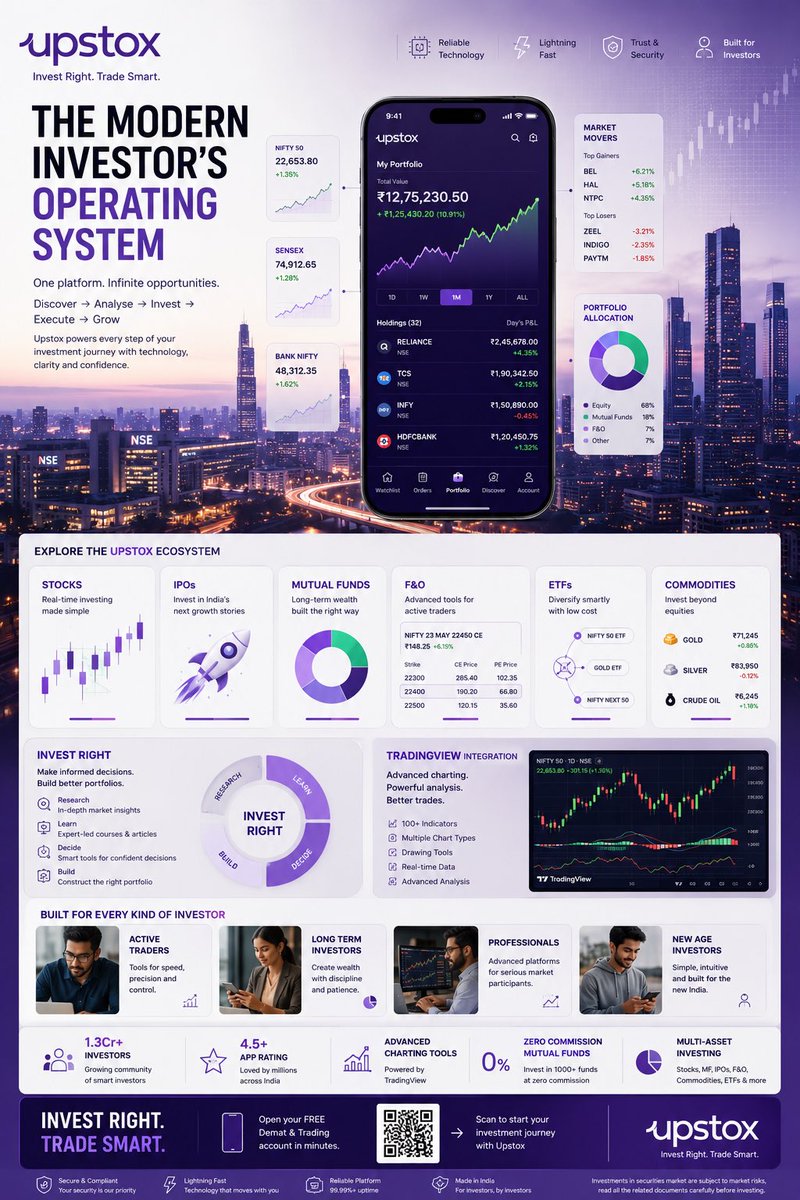
Fintech Investing Infographic Poster
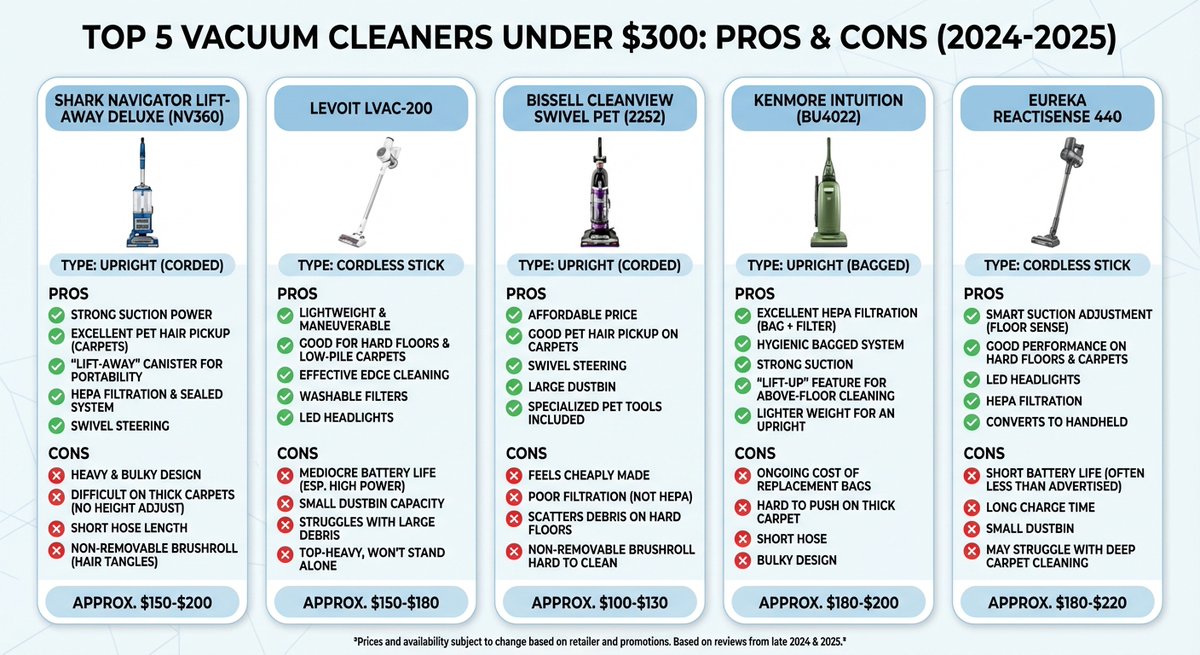
Vacuum Cleaner Comparison Infographic
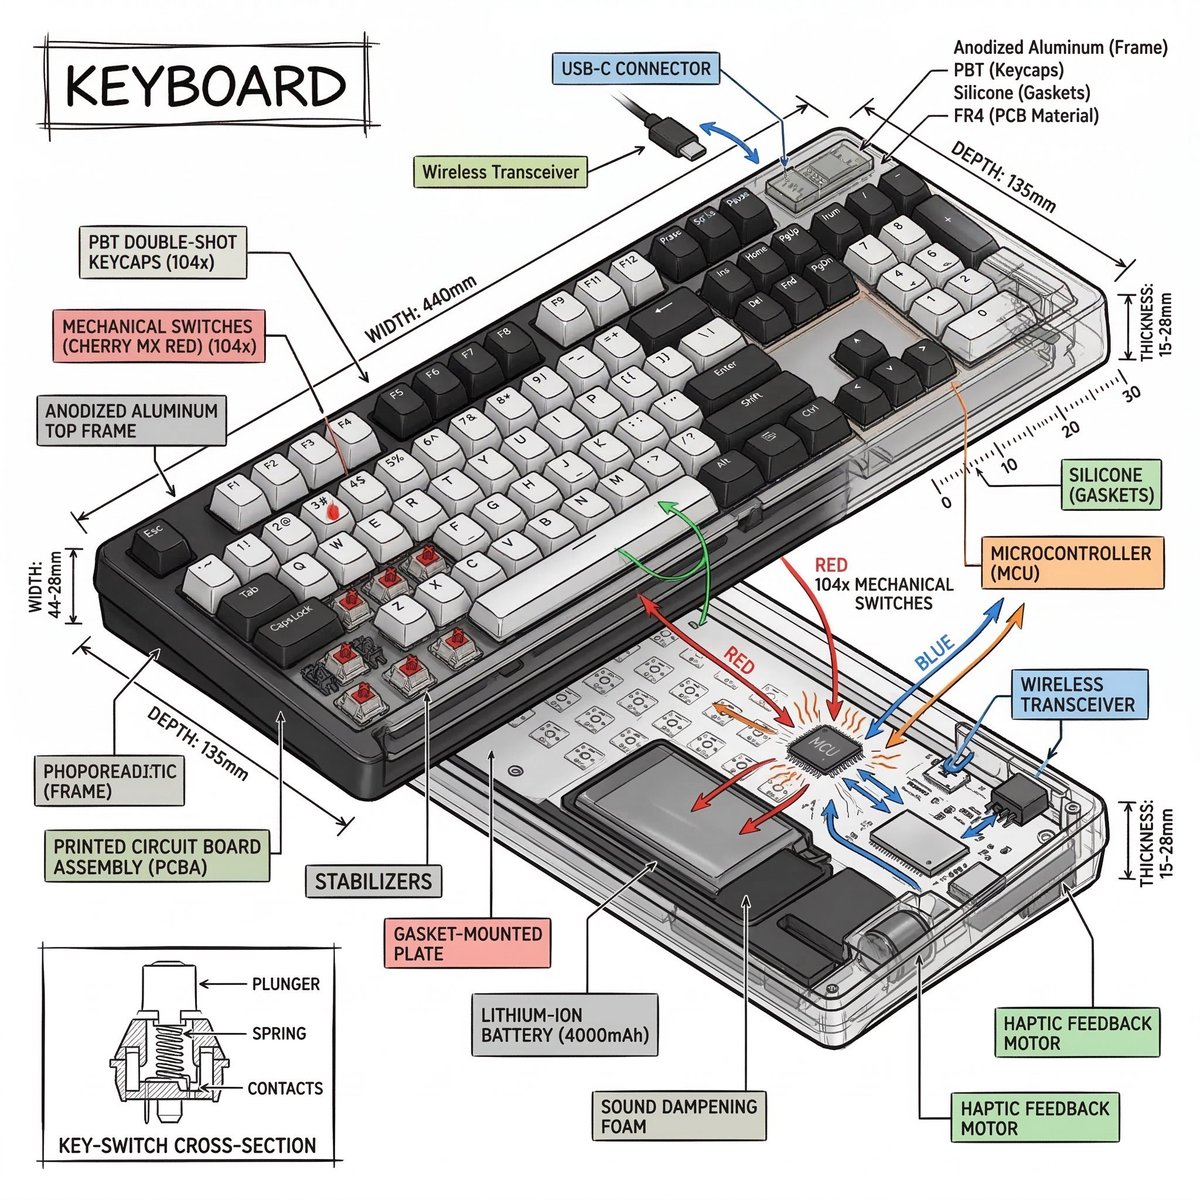
Isometric Technical Infographic
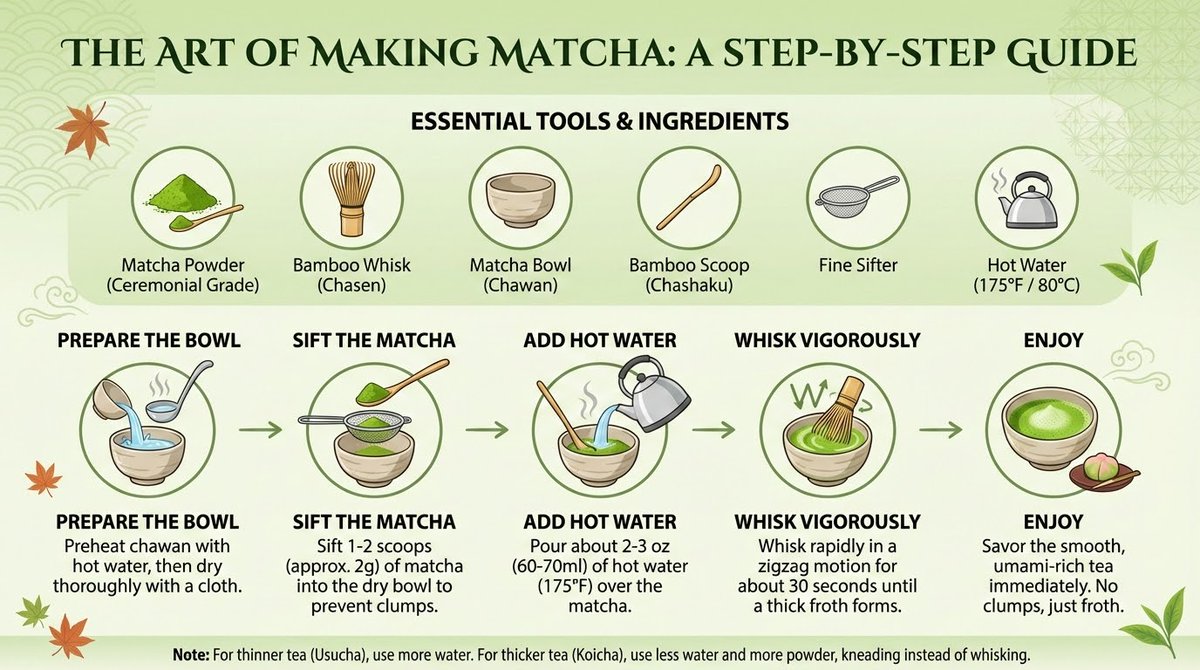
How to Make Matcha Infographic
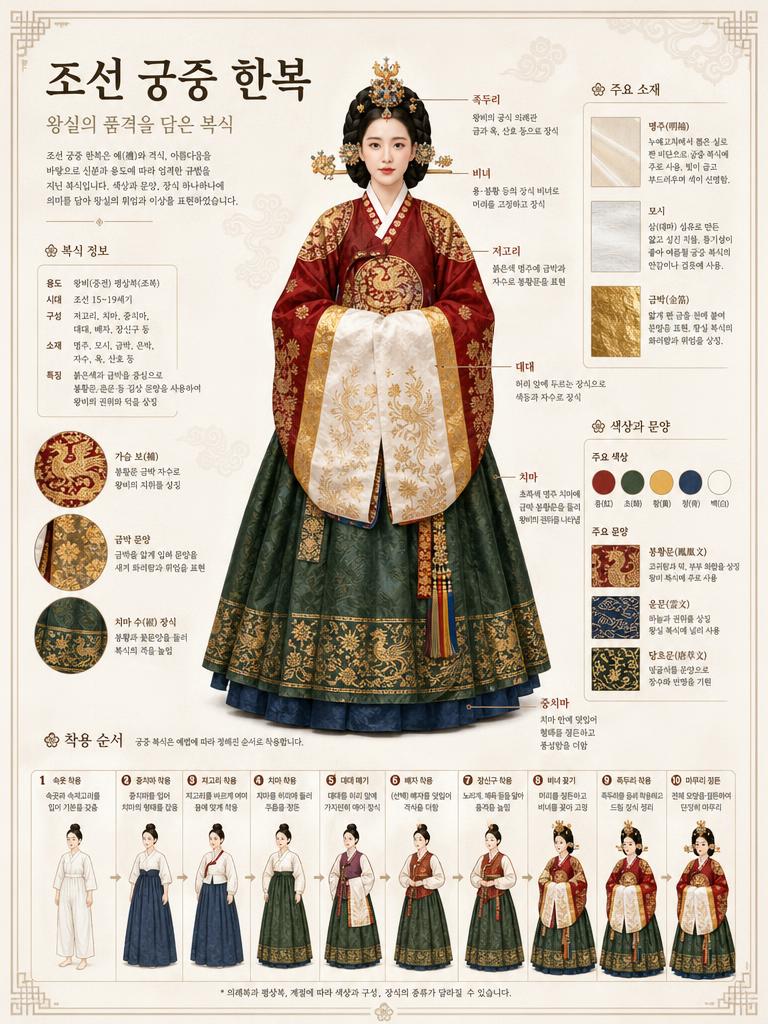
Museum-Style Hanbok Analysis Infographic
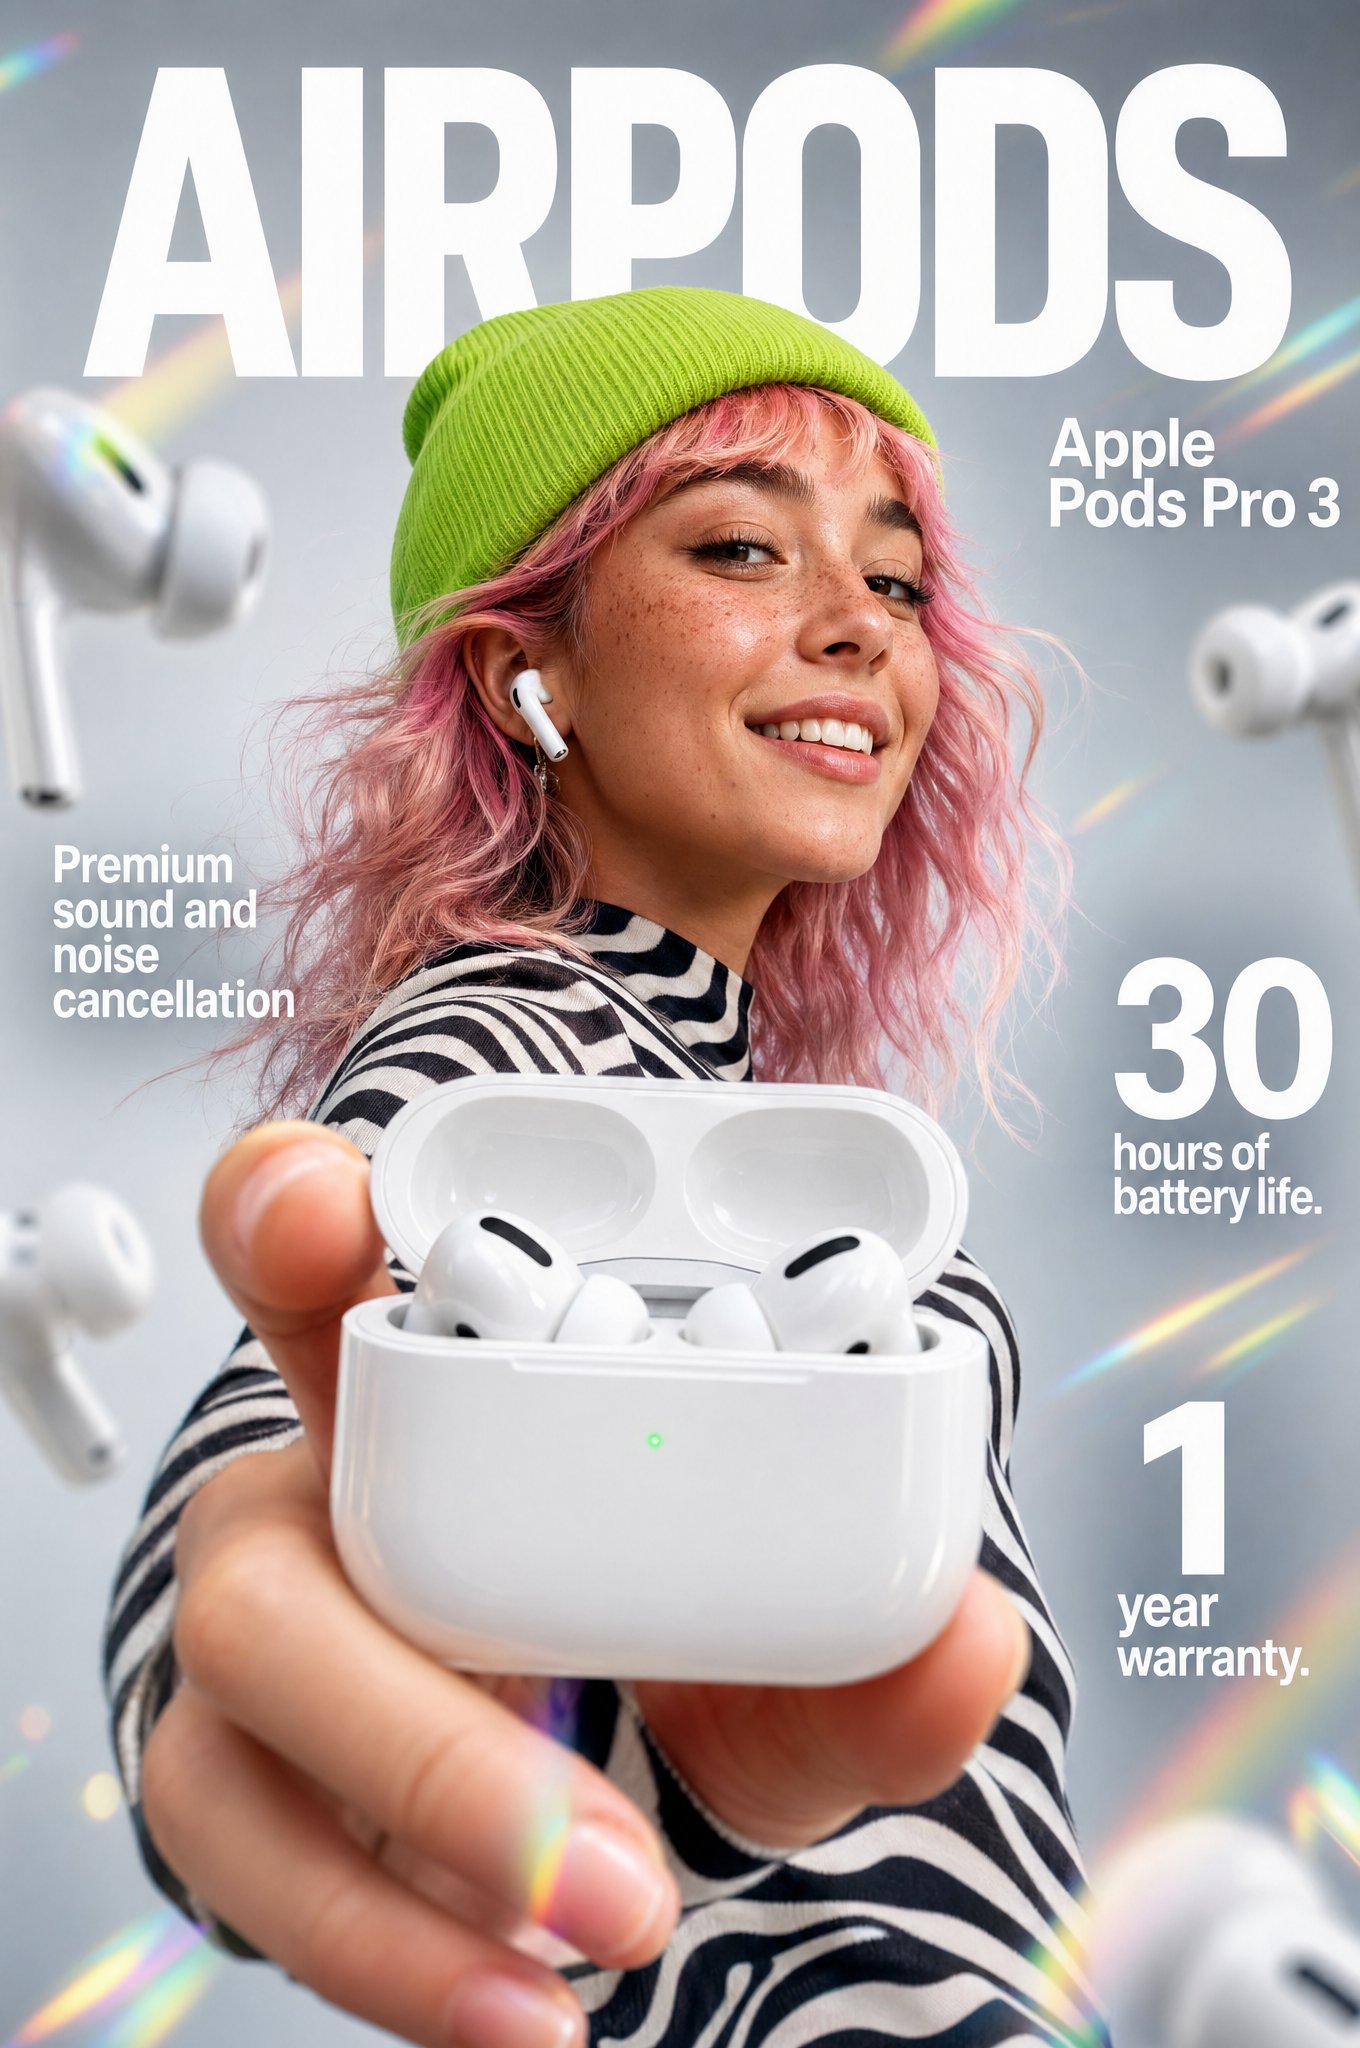
Apple Pods Pro 3 Earbuds Infographic
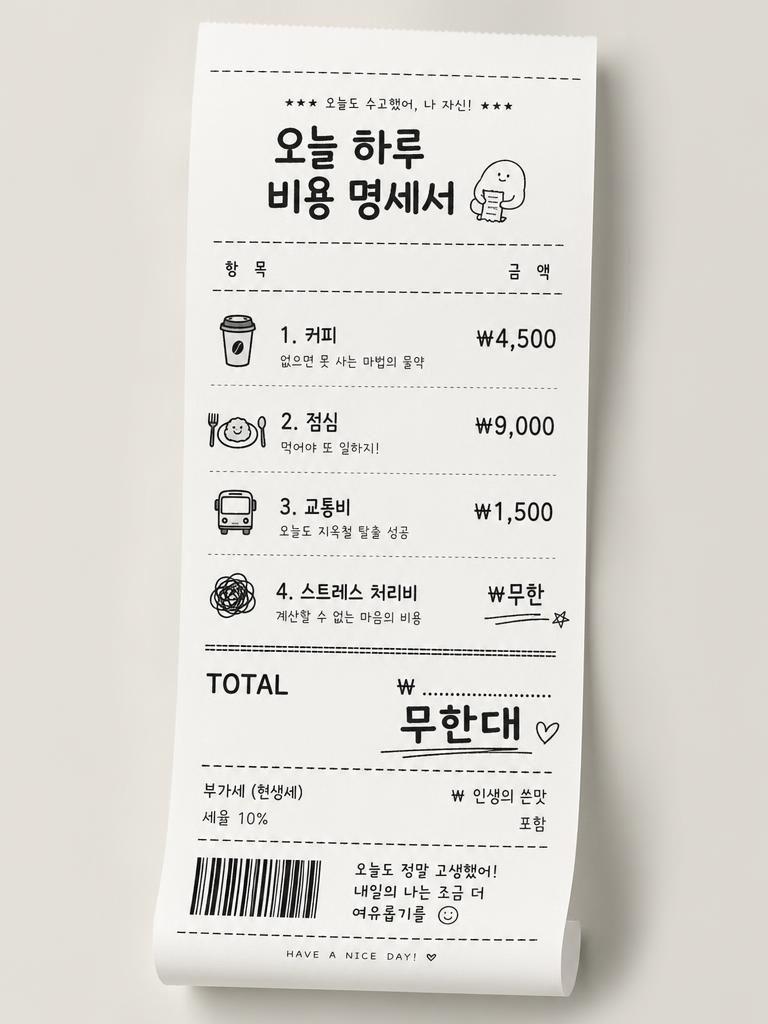
Creative Receipt-style Infographic Design
What Are Infographic Design AI Prompts?
Infographic design AI prompts generate designs that visually express complex data and information in an easily understandable format. Covering topics like nutrition guides, blood pressure management, fintech investment posters, human skeletal labels, and washing machine technical diagrams, these prompts create both beautiful and functional information designs. Rather than simply listing data, they structure information into visual hierarchies that help readers understand intuitively.
Carat's infographic prompt collection spans health, technology, finance, product, and cultural domains. From e-commerce infographics and luxury brand analysis to museum-style hanbok analysis and cinematic concept posters, these prompts deliver both information clarity and aesthetic completion.
Key Use Cases
- Healthcare content: Visual guides for nutrition, blood pressure management, and human anatomy
- Product technical explanations: Infographics showing technical features of washing machines, earbuds, and smartphones at a glance
- Fintech and finance: Visualizing investment guides, financial analysis, and monetary data clearly
- Brand analysis reports: Infographic designs analyzing luxury cosmetics, fashion brands, and product features
- Cultural and educational content: Information designs with educational value like hanbok analysis, food origin recipes, and museum-style layouts
Why This Tag Is Useful
Infographics are a consistently in-demand design format across marketing, education, and media due to their high information delivery efficiency. Keywords like 'infographic', 'information design', and 'data visualization' have search volume across both B2B and B2C contexts. In a digital marketing environment where data-driven content is increasingly important, the ability to quickly generate infographic concepts via AI without manual layout work adds significant value for designers and marketers.
Related Prompts
- Health Infographic
- Infographic
- PPT Design
- Poster
- Isometric Illustration
- Cutaway Diagram
- Blueprint Sheet
Prompt Construction Tips
- Define information structure: Specify data hierarchy including primary data, secondary data, and visual emphasis points for structured infographics.
- Use visual metaphors: Specify subject-appropriate metaphors like human skeleton, floor plans, or cross-sections for intuitive information delivery.
- Color-code categories: Assigning colors to data categories makes classification clear and improves readability.
- Choose layout style: Specify layout types like grid, flowchart, or timeline that match the information flow for effective communication.
Infographic design prompts operate at the intersection of information and aesthetics. By combining these tips, you can transform any complex data into an understandable and beautiful visual.