원인과 결과를 범주별 가지로 정리하는 피쉬본 다이어그램 AI 프롬프트입니다.
2026.07.16
「피쉬본 다이어그램」 원하는 대로 직접 만들어보세요「피쉬본 다이어그램」 직접 만들어보세요
대화로 요청만 하면 최적화된 이미지·영상을 만들어줘요

매일 무료 100크레딧으로 바로 시작
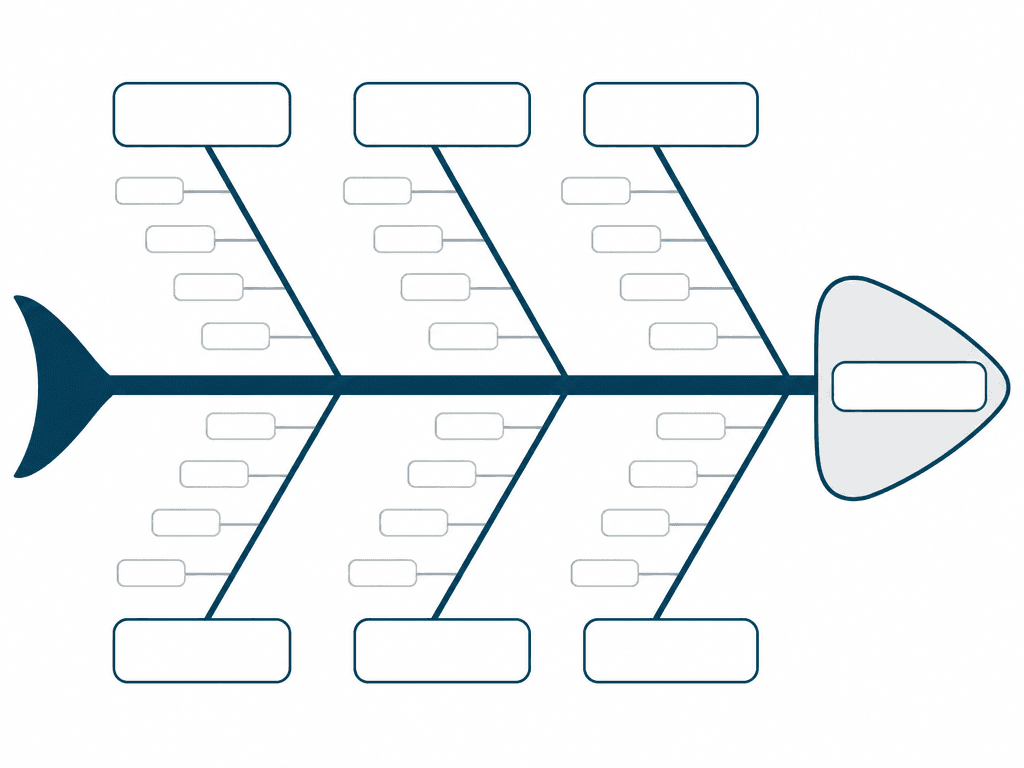
분석할 결과를 오른쪽 머리 영역에 한 문장으로 정의하고 기간, 대상, 발생 조건을 함께 기록합니다. 해결책이나 추측을 문제 문장에 섞지 않아야 팀이 같은 현상을 분석할 수 있습니다. 회의 전에 실제 데이터와 관찰 기록을 준비하고, 확인되지 않은 의견은 가설로 표시합니다.
사람, 방법, 장비, 재료, 환경, 측정처럼 자주 쓰는 범주는 출발점일 뿐입니다. 서비스나 콘텐츠 업무라면 고객 여정, 정책, 도구, 채널 등 주제에 맞게 바꿉니다. 큰 가지에는 범주를, 작은 가지에는 구체적인 원인 후보를 하나씩 적고 중복 원인은 합칩니다.
참여자가 원인 후보를 개별 작성한 뒤 비슷한 항목을 묶고 근거가 있는 순서로 검토합니다. 왜라는 질문을 반복하되 개인 비난으로 흐르지 않도록 프로세스와 조건을 중심으로 씁니다. 영향도와 확인 가능성을 기준으로 우선순위를 정하고 담당자와 검증 기한을 따로 기록합니다.
가지의 선 굵기와 각도, 레이블 크기를 일정하게 유지하고 색만으로 범주를 구분하지 않습니다. 긴 문장은 짧은 명사구로 줄이고 충분한 여백을 둡니다. 화면 공유와 인쇄 모두에서 작은 가지가 겹치지 않는지 확인하며, 생성된 글자 대신 편집 가능한 텍스트를 후편집합니다.
최종 도식은 회의 메모가 아니라 검증 계획과 연결되어야 합니다. 각 원인 옆에 데이터 출처, 확인 방법, 책임자와 상태를 별도 표로 관리합니다. 원인과 상관관계를 혼동하지 않았는지, 빠진 이해관계자가 없는지 검토하고 변경 이력을 남긴 뒤 공유합니다.